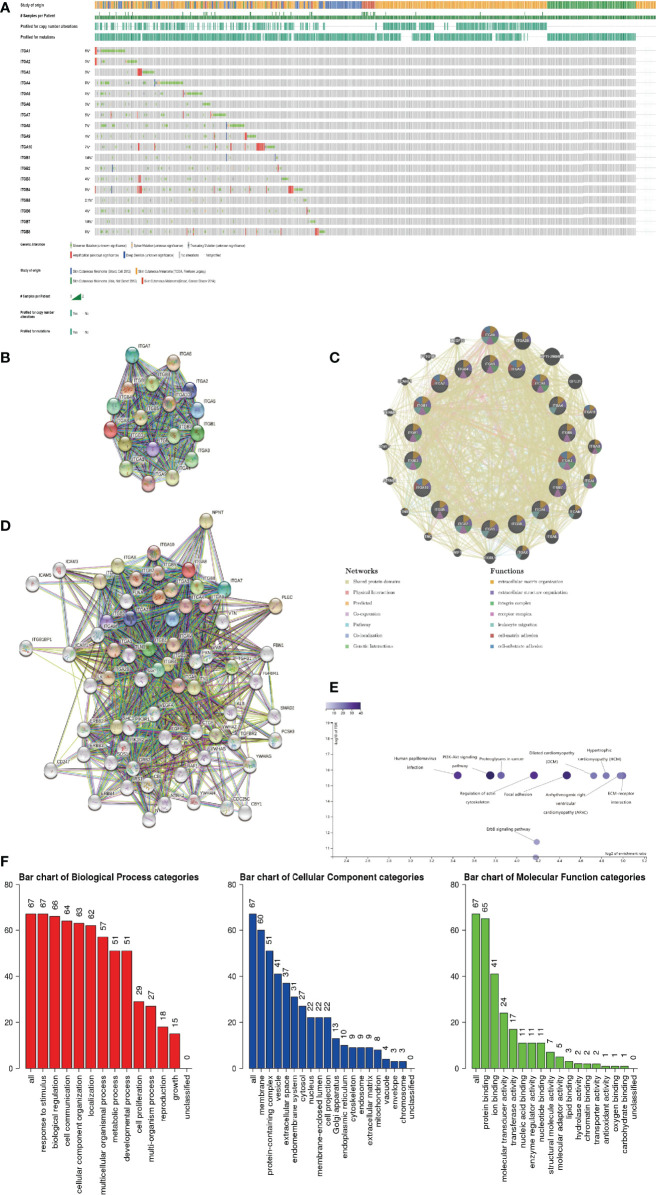
Figure 9.
(A) Summary of genetic alterations in different integrin subunits in SKCM. (B, C) Protein-protein interaction network of different integrin subunits. (D) Gene-gene interaction network of different integrin subunits and 48 most frequently altered neighboring genes. (E, F) Enrichment analysis of different integrin subunits and 48 most frequently altered neighboring genes in SKCM (Webgestalt). (E) Bar plot of KEGG enriched terms. (F) Bar plot of GO enrichment in biological process terms, cellular component terms, and molecular function terms.

