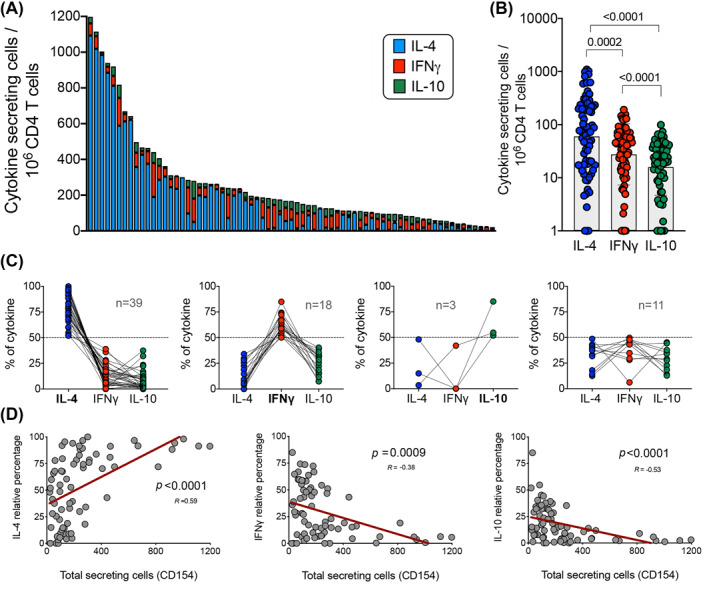
FIGURE 2.

Baseline cytokine responses of CD154+ cells are IL‐4 polarized and correlate with magnitude of responses. (A) Graph bars show the overall magnitude of CD4+ T cell CR‐specific responses as the sum of the 11 individual allergens tested. Each bar represents a participant (n = 71) and the fraction of the response accounted for each cytokine (IL‐4 (blue), IFNγ (red), or IL‐10 (green)). (B) Graph compares the IL‐4, IFNγ and IL‐10 allergen responses for all the individual participants combined. Geometric mean and p value are shown as statistically significant by Wilcoxon's paired t‐test. (C) Graphs depict the percentage of each individual cytokine contribution from total response, grouped as function of the IL‐4, IFNγ, IL‐10 dominant (>50% of total response) or non‐dominant cytokine profile for a particular participant. Each dot and interconnected lines represents a participant and the number of participants in each group is shown. (D) Graphs show the correlation of total cytokine response with the relative IL‐4, IFNγ and IL‐10 cytokine response. R values and p values are shown as statistically significant by nonparametric Spearman correlation test and best fit represented by a linear regression line (red)
