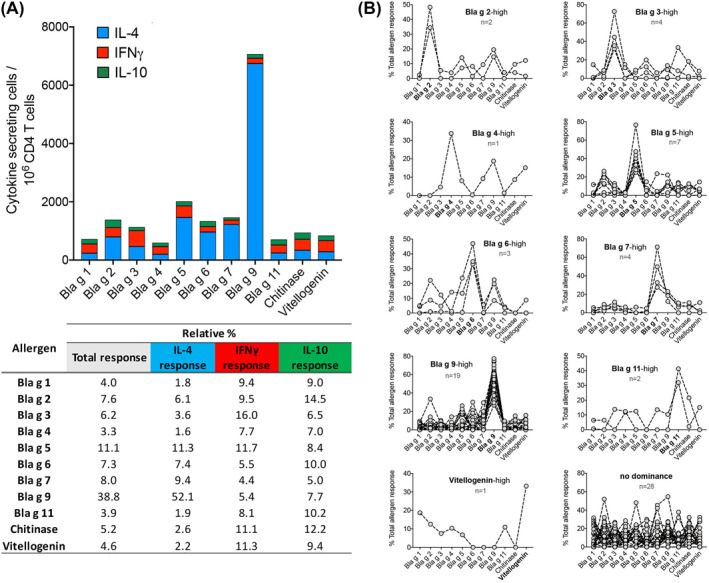
FIGURE 3.

Bla g 9 and Bla g 5 are the most immunodominant allergens and dominance is participant specific. (A) Graph shows the overall response directed against the 11 allergens tested, calculated by summing each individual allergen response for all participants. Each bar represents an allergen and the fraction of the response accounted for each cytokine (IL‐4 [blue], IFNγ [red], or IL‐10 [green]). Table depicts the percentage of total or individual cytokine responses for each allergen. (B) Graphs show for each individual participant (dots and interconnected lines) the fraction of the response accounted for each allergen and grouped as a function of allergen immunodominance (‐high) or lack of dominance. Bla g 1 and Chitinase not shown in graphs as no dominant responses were observed. The number of participants associated with each category is shown
