Figure 4.
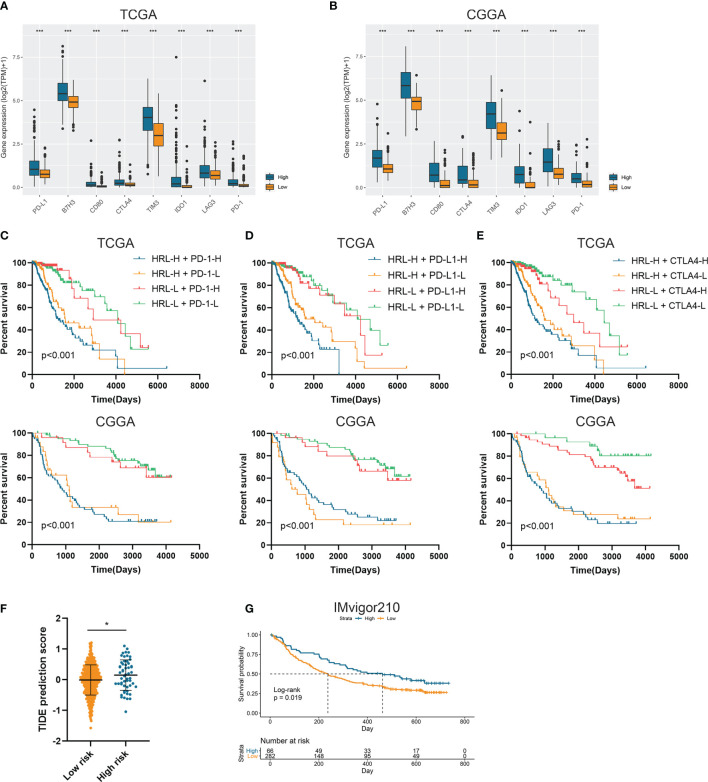
Risk stratification correlated with the efficacy of immunotherapy. (A, B) The expression of several immune checkpoints in high-risk and low-risk groups in the TCGA (A) and CGGA (B) datasets. (C–E) Kaplan-Meier analyses of overall survival among four patient groups stratified by the HRL signature and PD-1 (C), PD-L1 (D), and CTLA-4 (E). (F) TIDE score of high-risk and low-risk groups in TCGA dataset. (G) Kaplan-Meier analysis of urothelial carcinoma patients stratified by HRL signature in IMvigor210 cohort. *p < 0.05, ***p < 0.001.

