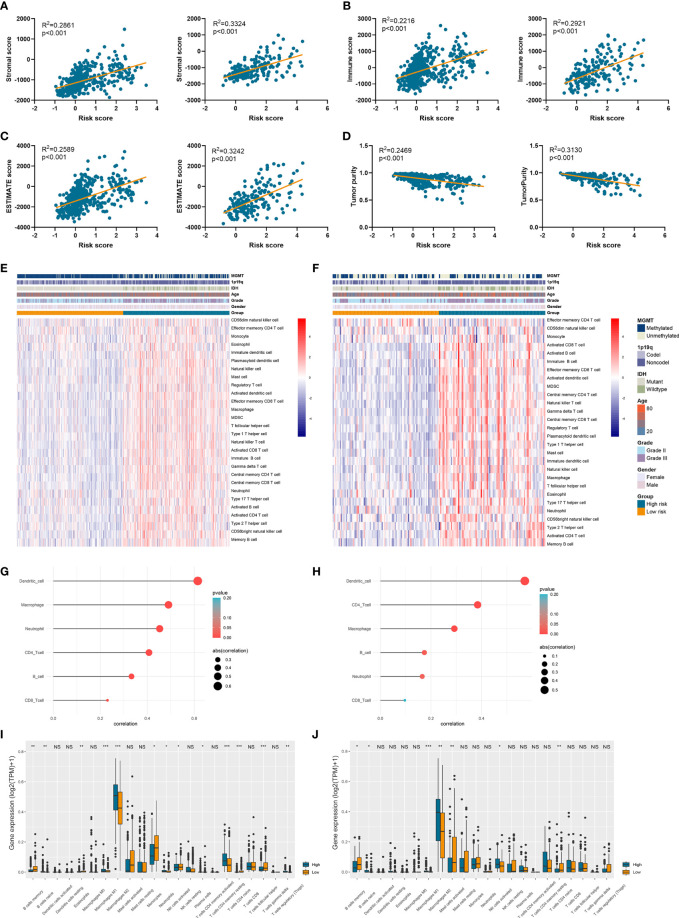
Figure 6.
Risk signature was associated with tumor purity and immune infiltration. (A–D) The association between risk score and stromal score (A), immune score (B), ESTIMATE score (C), and tumor purity (D). (E, F) The abundance of 28 immune cells estimated by ssGSEA algorithm in high-risk and low-risk groups in TCGA (E) and CGGA (F) datasets. (G, H) The correlation between risk score and six immune cells estimated by TIMER algorithm in TCGA (G) and CGGA (H) datasets. (I, J) The abundance of 22 immune cells estimated by CIBERSORT algorithm in high-risk and low-risk groups in TCGA (I) and CGGA (J) datasets. *p < 0.05, **p < 0.01, ***p < 0.001, ns, no significance.

