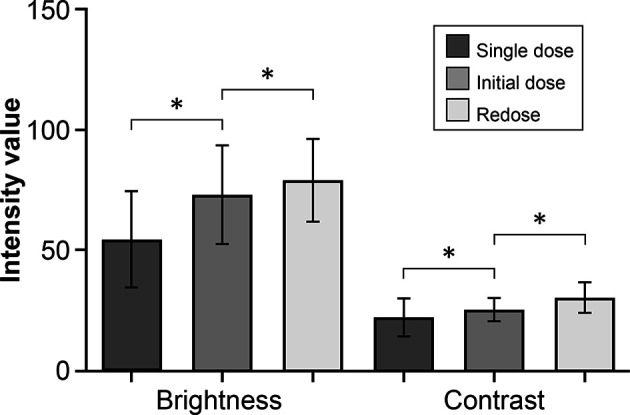
Figure 1.

Bar plot showing a comparison of the mean (SD) intensity modalities in the fluorescein sodium redose, initial-dose, and single-dose groups. The top and bottom whisker marks indicate the SD. *P < 0.001. The mean (SD) values of brightness and contrast of images are 79.1 (17.2) and 30.5 (6.3), respectively, in the redose group; 73.1 (20.4) and 25.4 (4.9) in the initial-dose group; and 54.6 (20.0) and 22.2 (7.9) in the single-dose group. The values are reported in units of optical density defined by Fiji open-source analytic software. Brightness is the mean gray value, calculated by the sum of the gray values of all the pixels in the selection divided by the number of pixels. Contrast is the SD of gray values used to generate the mean. SD, standard deviation. Used with permission from Barrow Neurological Institute, Phoenix, Arizona.
