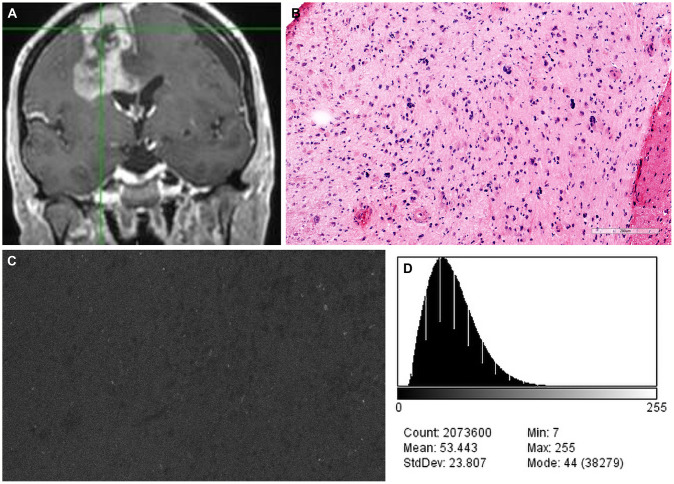
Figure 6.
Case example of confocal laser endomicroscopy (CLE) images acquired after a single dose of fluorescein sodium (FNa) before the concept of redosing was introduced. (A) Coronal T1-weighted magnetic resonance image with contrast. Biopsy specimens were obtained from the enhancing tumor in the left frontal lobe. (B) A diagnosis of high-grade glioma was made on the basis of H&E staining of biopsy specimens. (C) A CLE image acquired 180 minutes after FNa injection is dark and noninterpretable. (D) A corresponding histogram shows the intensity values of the CLE image. Count, number of pixels; Mean, brightness; StdDev, contrast; Min and Max, minimum and maximum gray values within the image; Mode, most frequently occurring gray value within the selection corresponds to the highest peak in the histogram. Used with permission from Barrow Neurological Institute, Phoenix, Arizona.

