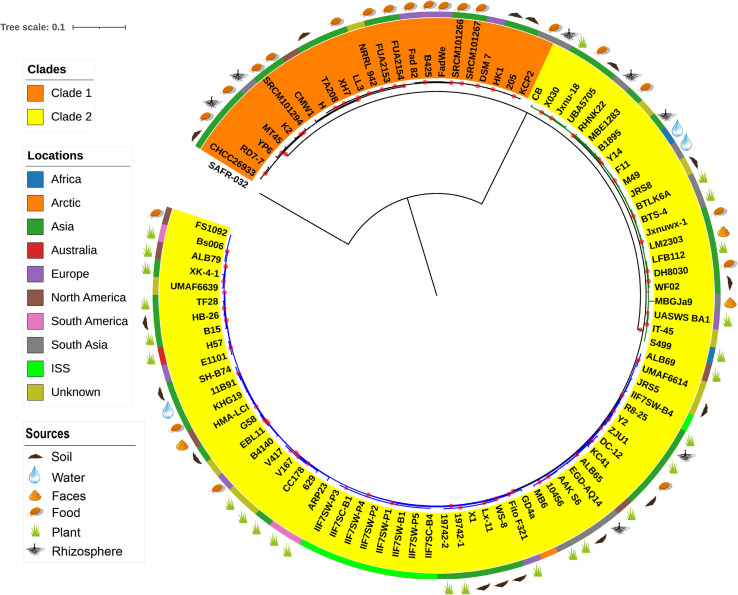
FIGURE 2.
The phylogenetic tree of single-copy core proteins. The maximum-likelihood tree was constructed by the module “CoreTree” of PGCGAP v1.0.21 (Liu et al., 2020) with the best fit model JTT+F+R4. The tree was rooted against Bacillus pumilus SAFR-032 as an appropriate outgroup. Red circles on the branch represent bootstrap values larger than 80%. The background color of the labels (colored ranges) represents the clades, and the green and blue branches represent cluster 1 and cluster 2 of clade 2, respectively. The color strip outside the tree describes where the strain was isolated; ISS means International Space Station. The cartoons outside the tree indicate that the strain was isolated from soil, food, rhizosphere, water, or faces of herbivores, or is associated with the plant.

