
Figure 5.
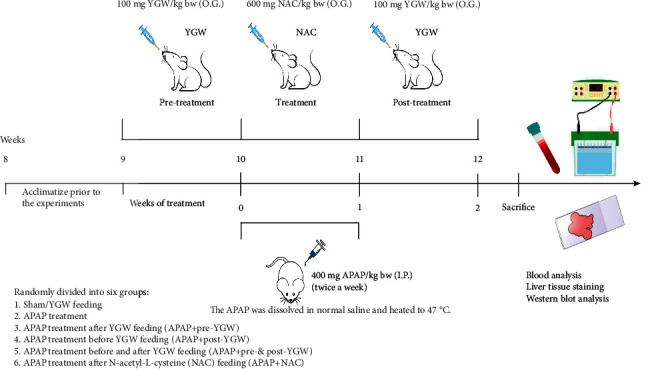
Experimental design that draws the timeline of the action of YGW, LPS, and APAP, and the dosage of drugs and the time points of analyses. The dosage of YGW, APAP, and NAC was also shown. IP: intraperitoneal injection; OG: oral gavage.
Official websites use .gov
A
.gov website belongs to an official
government organization in the United States.
Secure .gov websites use HTTPS
A lock (
) or https:// means you've safely
connected to the .gov website. Share sensitive
information only on official, secure websites.
Experimental design that draws the timeline of the action of YGW, LPS, and APAP, and the dosage of drugs and the time points of analyses. The dosage of YGW, APAP, and NAC was also shown. IP: intraperitoneal injection; OG: oral gavage.