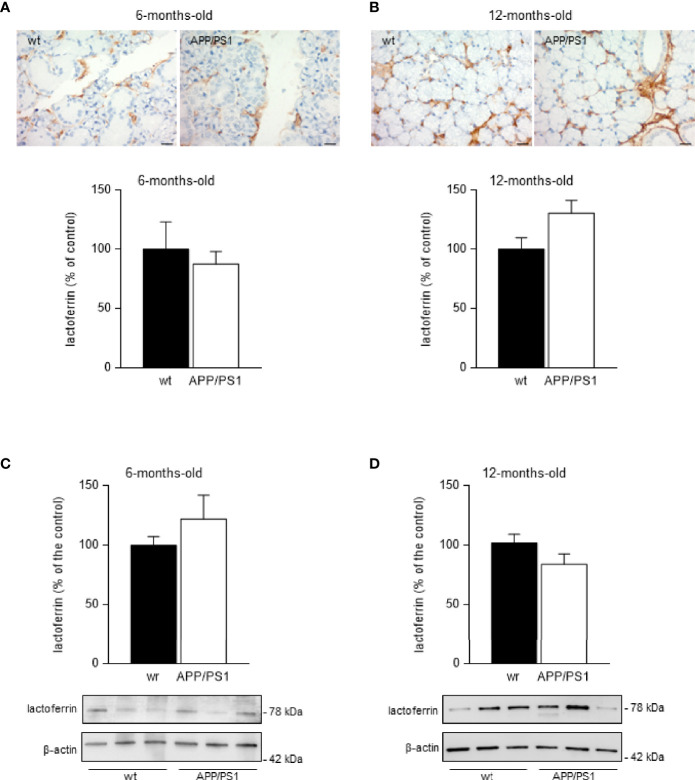
Figure 2.
Lactoferrin levels in mice submandibular glands. (A, B) Lactoferrin stained (brown) sections of submandibular glands from (A) 6- and (B) 12-month-old APP/PS1 and WT mice. Size bar 20 μm. All sections were counterstained with haematoxylin (blue). In the lower histograms, quantification of the lactoferrin signal from 6- and 12-month-old APP/PS1 and WT mice submandibular glands, respectively (n = 8, per group) is shown. (C, D) Western blot analysis showing lactoferrin levels in submandibular glands from (C) 6- and (D) 12-month-old APP/PS1 and WT mice (n = 12-18, per group). Representative Western blots (lower panels) and histograms with their densitometric analysis (upper panels) are shown. Data are represented as mean ± SEM. Differences between groups were assessed using the Mann-Whitney test.

