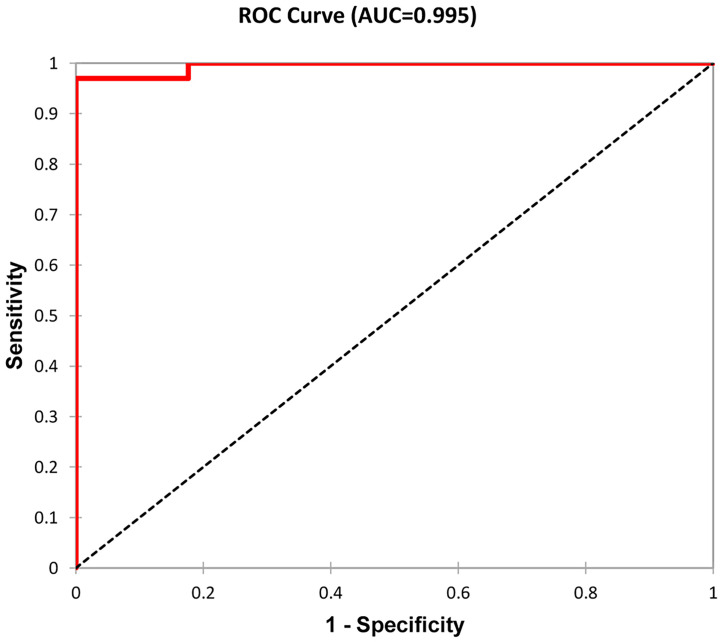
Figure 4.
ROC curve as a graphical representation of logistic regression. Patients were distributed according to the time from kidney transplant to graft failure and the time from renal biopsy to end-stage renal disease into two groups (see Table 3 ). A total of 50 patients with graft failure were divided into two groups with 17 and 33 members. Classification accuracy was 96%.

