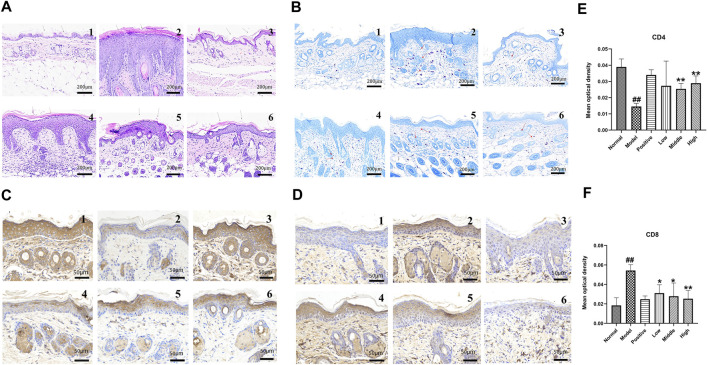
FIGURE 4.
(A) H&E staining results of mice skin tissue. (B) Mast cell count by toluidine blue staining. (C) CD4 cell staining results. (D) CD8 cell staining results (note 1: normal group, 2: model group, 3: positive drug group, 4: low-dose group, 5: middle-dose group, and 6: high-dose group). (E) Immunohistochemical detection of CD4 cell expression in skin lesions on the back of mice. (F) Immunohistochemical detection of CD8 cell expression in skin lesions on the back of mice (note: data are expressed as mean ± SD (n = 3) compared with the normal group ##p < 0.01, compared with the model group, *p < 0.05, **p < 0.01).

