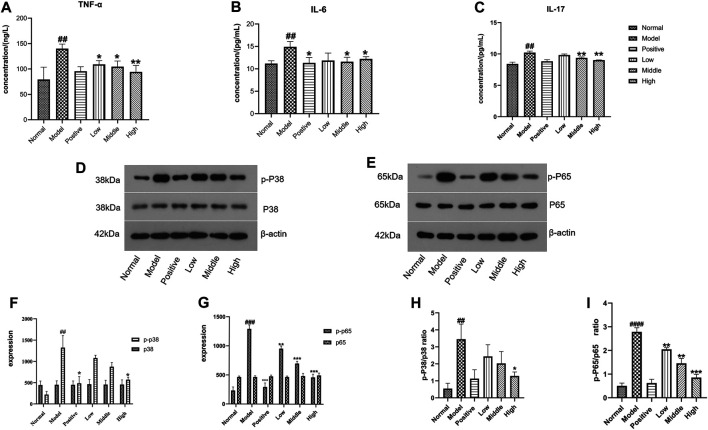
FIGURE 5.
(A) ELISA detection of TNF-α. (B) the ELISA detection of IL-6. (C) ELISA detection of IL-17 (note: the data are expressed as the mean ± SD (n = 3), compared with the normal group ##p < 0.01, compared with the model group, *p < 0.05, **p < 0.01). (D–I) Western blot was used to detect the protein expression levels of p-p38, p38, p-p65, p65,p-p38/p38, and p-p65/p65. (D,E) Quantitative protein expression levels of p-p38, p38, p-p65, and p65. (F,G) Protein expression level of p38, p-P38, p65, and p-P65. (H,I) Ratio of p-P38/p38 and p-P65/p65 in mouse skin lesions. (x¯±s (n = 3), compared with the normal group ###p < 0.001, ##p < 0.01, compared with the model group ***p < 0.001,*p < 0.05).

