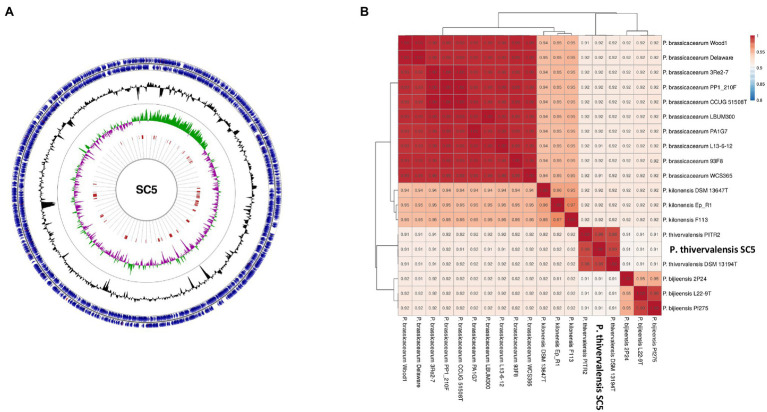
Figure 2.
Representation of the P. thivervalensis SC5 genome. (A) Circular representation of the genome and its properties, including genes (blue), GC% (black), GC% skew [(+) green, and (−) pink] and genomic islands (red); (B) Phylogenomic analysis based on average nucleotide identity (ANI) values of selected Pseudomonas strains.

