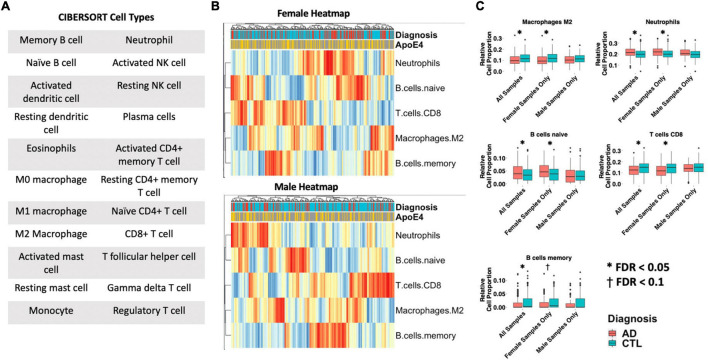
FIGURE 5.
Cell type analysis in whole blood. (A) Cell types included in the panel of 22 reference cell types in CIBERSORT. (B) Heatmap depicting cell type expression between cases and controls. APOE ε4 carrier status, sex, and case/control status is annotated for each sample. Only cell types that are significantly different between cases and controls in pooled male and female, male-only or female-only analyses are shown. (C) Bar charts depicting cell type expression for individual cell types that are significantly between cases and controls in pooled male and female, male-only or female-only analyses are shown. Significance was assessed by associated cell type proportion to case/control status, adjusting for age, sex (in the pooled male and female model) and APOE ε4 status. P < 0.05 was deemed significant.

