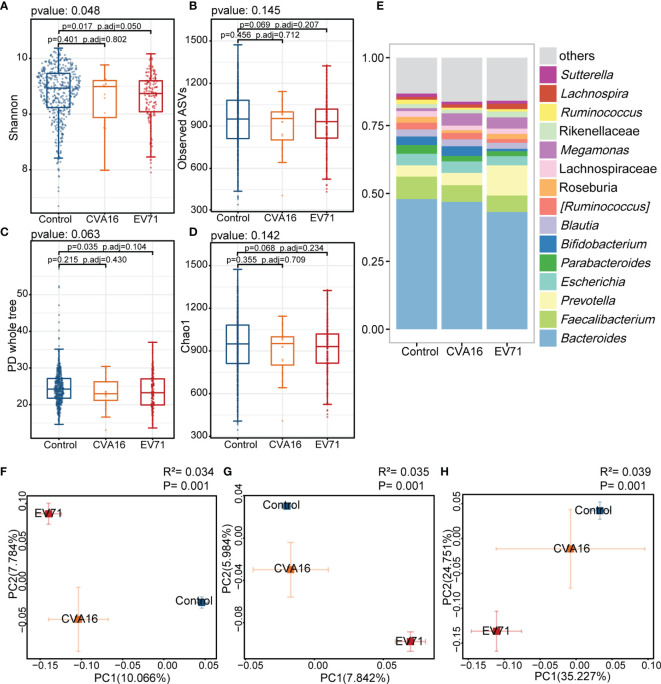
Figure 3.
Comparison of the gut microbiota between EV71, CVA16, and control group. (A–D) Alpha diversity. Comparison of alpha-diversity indices (Shannon, observed ASVs, PD whole tree and Chao 1 index) among EV71-infected HFMD, CVA16-infected HFMD and control groups (Kruskal-Wallis tests). (E) Relative abundance of the bacterial microbiota at the genus level among EV71, CVA16, and control group. (F–H) Beta diversity. Principal coordinate analysis (PCoA) based on the Bray-Curtis distance (F), unweighted UniFrac distances (G) and weighted UniFrac distances (H) revealed that the relationship of bacterial communities among EV71-infected HFMD, CVA16-infected HFMD and control groups. The explanation of diversity captured by the coordinate is given as a percentage.

