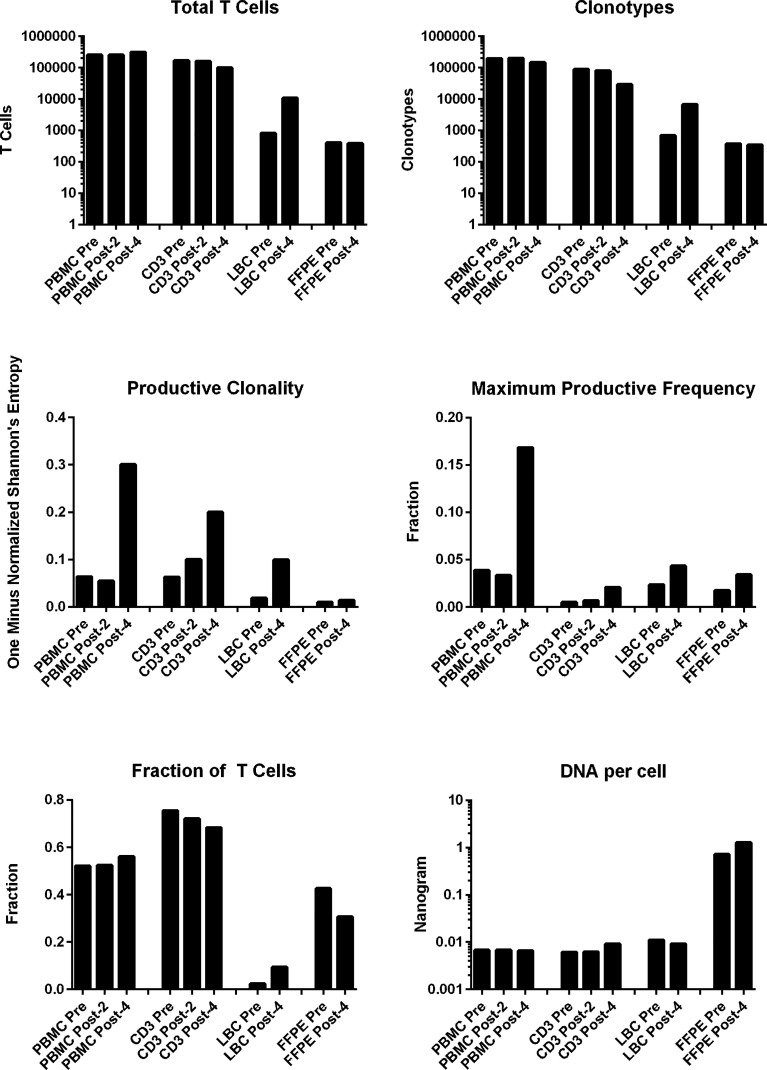
Figure 2.
T cell structures of PBMCs stimulated CD3+ T cells, LBC, and FFPE samples described with multiplexed PCR-based TCR sequencing using genomic DNA. The T cell structures of the 4 sample types (PBMCs, stimulated CD3+ T cells, LBC, and FFPE) are shown as the total number of T cells defined by nucleotide sequence, productive clonality (one minus normalized Shannon’s entropy for all productive rearrangements), fraction of T cells (the number of productive templates divided by the number of nucleated cells), number of clonotypes defined by nucleotide sequence, maximum productive frequency (the most frequent specific productive rearrangement among all productive rearrangements within a sample), and the quantity of DNA (ng) per nucleated cell. The number of nucleated cells were determined using amplification of reference gene primers.

