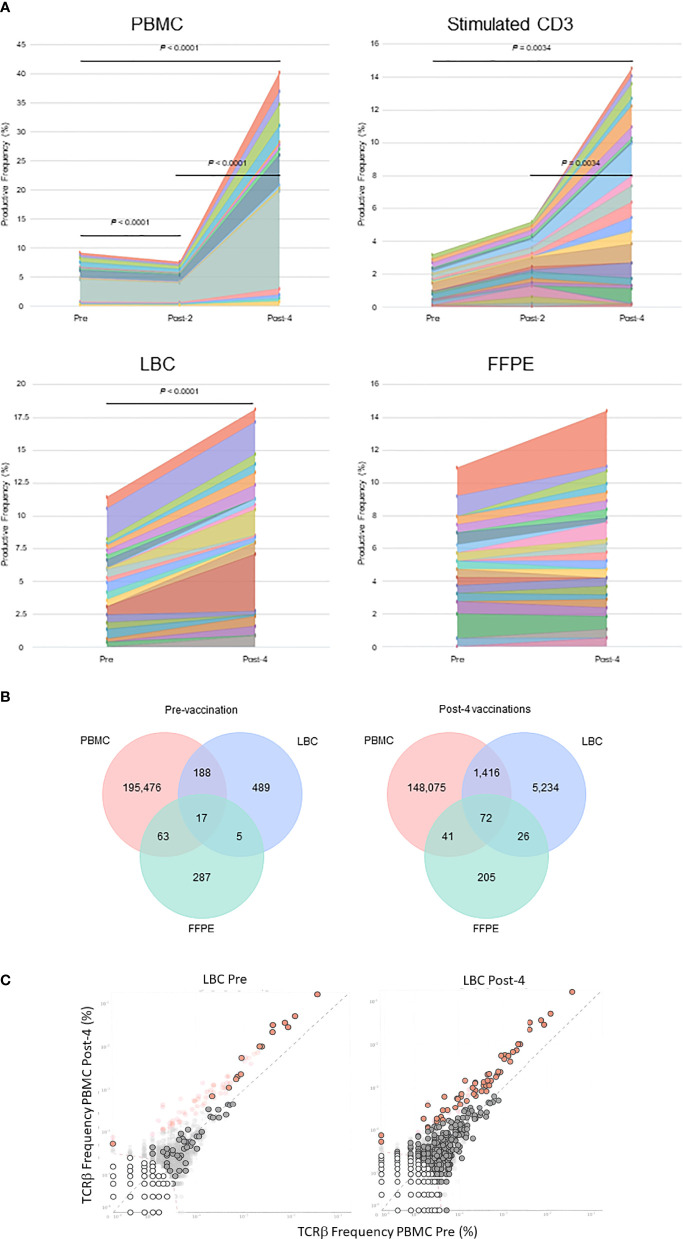
Figure 3.
Tracking of clonotypes in the peripheral blood and cervix. (A) Tracking of the top 15 clonotypes defined by nucleotide sequence are shown in productive frequency. The top 15 highest frequency clonotypes were significantly decreased after 2 vaccinations (Wilcoxon matched-pairs signed-ranks test, p=0.0012), but significantly increased after 4 vaccinations (p<0.0001) in PBMC samples calculated using the numbers of T cells. For stimulated CD3+ T cell samples, significant increases were seen between pre-vaccination and post-4 vaccinations (p=0.034) and between post-2 and post-4 vaccinations samples (p=0.0034). A significant increase was seen in LBC samples (p<0.0001) but not in FFPE samples. (B) Venn diagrams of clonotypes defined by nucleotides in PBMC, LBC, and FFPE samples pre-vaccination and post-4 vaccinations. Most clonotypes appear only in one sample type, but there are 17 TCRs present in PBMCs, LBC, and FFPE at the pre-vaccination visit and 72 TCRs at the post-4 vaccination visit. (C) Putatively vaccine-specific clonotypes in LBC samples before and after 4 vaccinations. Seventy putatively vaccine-specific clonotypes were identified through a comparison of post-4 PBMC and pre PBMC samples using the beta-binomial model (shown as red dots with and without black circular borders). Red dots with black circular borders represent these putatively vaccine-specific TCRs present in pre-vaccination LBC sample (n=15) and in post-4 vaccination LBC sample (n=57). Dark grey dots are not significantly different between pre-vaccination and post-4 vaccinations PBMC samples. Dark grey dots with black circular borders are not significantly increased but are present in the respective LBC sample. Light grey dots without black circular borders are not present in the respective LBC sample.

