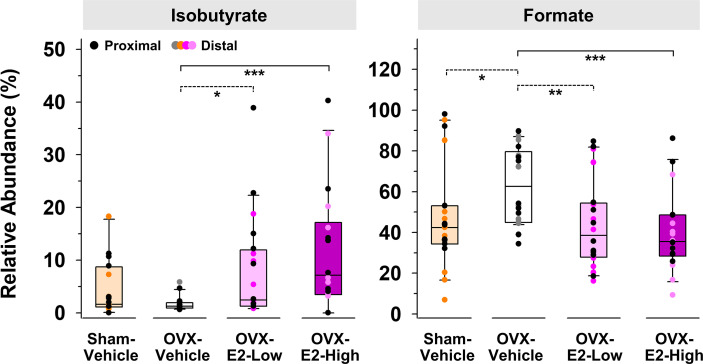
Figure 2.
Short-chain fatty acids that displayed a significantly (LEfSe) higher or lower relative abundance in OVX-E2-Low or OVX-E2-High rats compared to OVX-Vehicle rats. The asterisks indicate statistically significant differences (*p ≤ 0.05; **p ≤ 0.01; ***p ≤ 0.001). Solid lines between groups indicate significant q values (q ≤ 0.05). Dashed lines between groups indicate non-significant q values. Group abbreviations (e.g., Sham-Vehicle) are described in Table 1 . Error bars indicate standard deviations.

