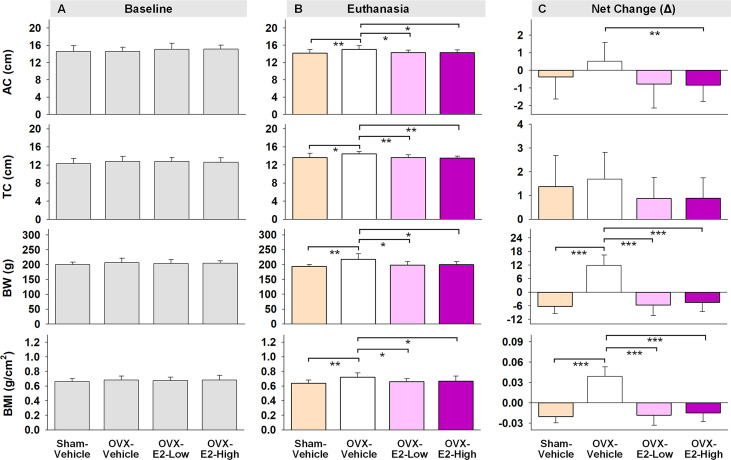
Figure 5.
Abdominal circumferences (AC), thoracic circumferences (TC), body weight (BW), and BMI at the beginning of experiment (A, Baseline), at the end of experiment (B, Euthanasia), and net changes (C). The asterisks indicate significant differences (*p ≤ 0.05; **p ≤ 0.01; ***p ≤ 0.001; pairwise comparison using Fisher’s PLSD post hoc test after ANOVA). Group abbreviations (e.g., Sham-Vehicle) are described in Table 1 . Error bars indicate SEM.

