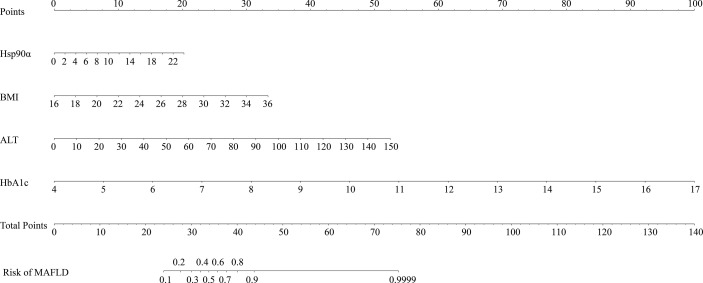
Figure 2.
Nomogram for the model to predict MAFLD. The graph shows the risk of MAFLD concerning Hsp90α, BMI, HbA1c, and ALT, respectively. Each risk factor corresponds vertically to the corresponding “point” value. Furthermore, the “total points” is the sum of the points for all risk factors, vertically corresponding to the predicted “risk of MAFLD”.

