Figure 3.
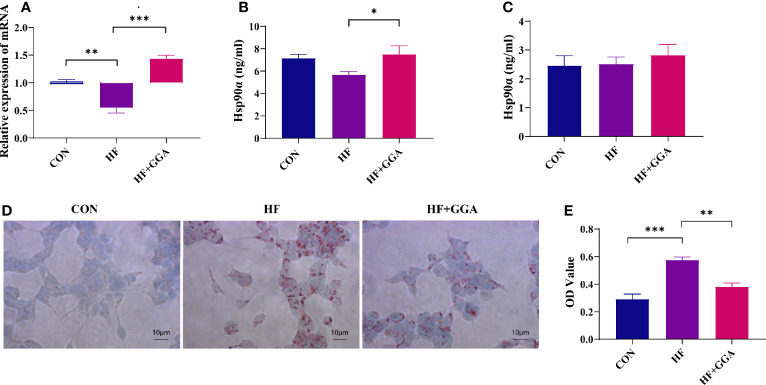
FL83b cell steatosis model. CON, control group; HF, steatosis group; HF+GGA, steatosis + 1 μM GGA group. (A) Expression of Hsp90α mRNA in FL83b cells. (B) Concentration of Hsp90α in FL83b cell homogenization tested by ELISA. (C) Hsp90α in supernatant derived from FL83b cells tested by ELISA. (D) Oil red O staining. (E) Quantitative analysis of oil red O staining. Data are presented as mean ± SEM. The significance among groups was determined using the two-way ANOVA with LSD’s multiple comparisons test.*p < 0.05, **p < 0.01, ***p < 0.001.

