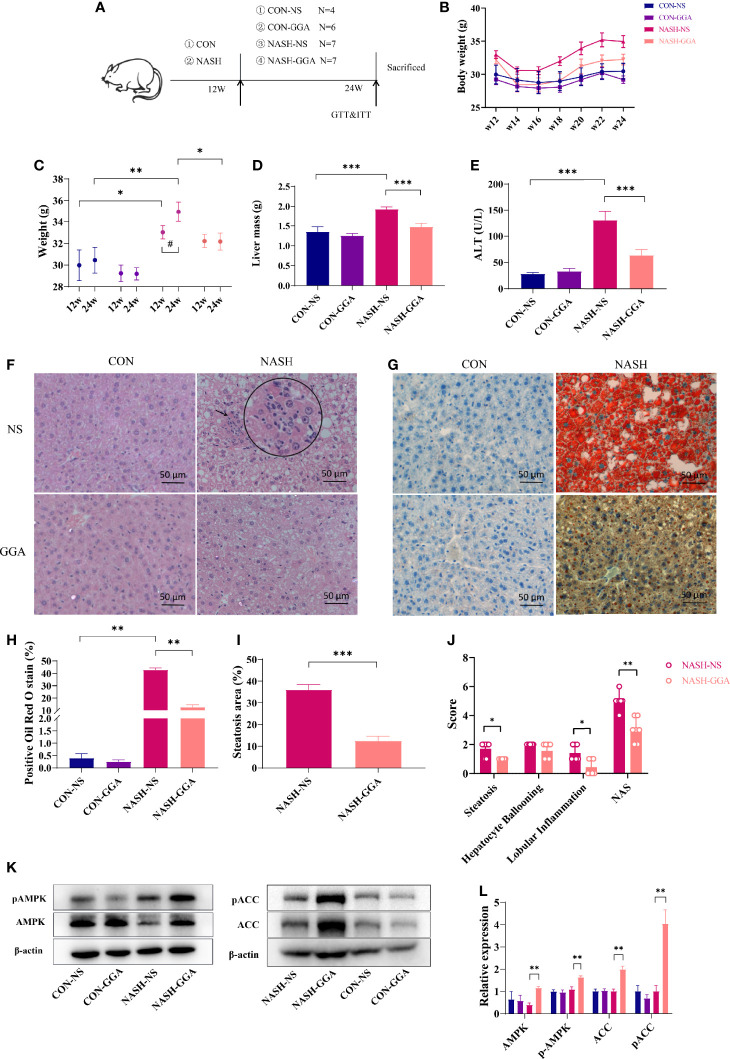
Figure 4.
GGA improved steatosis and steatohepatitis in MAFLD mice. (A) Four to 5-week-old male C57BL/6 mice were fed a normal diet (CON group)/Gubra Amylin NASH diet (NASH group) for 12 weeks and then administered GGA/NS once a day for 12 weeks. The whole experiment lasted 24 weeks. (B) The dynamic changes in the body weights of mice from 12 to 24 weeks during the investigation. (C) Comparison of body weights at 12 and 24 weeks. *Comparison of body weight at 12w and 24w between groups; #Weight changes from 12w to 24w. (D) Comparison of liver mass of mice in each group at 24 weeks. (E) Comparison of ALT levels of mice in each group at 24 weeks. (F) H&E staining of liver sections. The circle shows a zoom at the arrow. (G) Liver sections with oil red O staining. (H) Quantitative analysis of oil red O staining. (I) Comparison of hepatic steatosis area in the NASH-NS and NASH-GGA groups. (J) Comparison of NAS in the NASH-NS and NASH-GGA groups. (K, L) Expression of signaling proteins in each group. Data in (C–E, H, I, L) are presented as mean ± SEM. The significance among the groups was determined using the two-way ANOVA with LSD’s multiple comparisons test (# in (C) was determined by paired samples t-test.). Those in (J) are presented as a mean with a range; Mann-Whitney U test. (n = 4 in CON-NS group, n = 6 in CON-GGA group, n = 7 in NASH-NS group, n = 7 in NASH-GGA group). *,# p < 0.05.

