Figure 5.
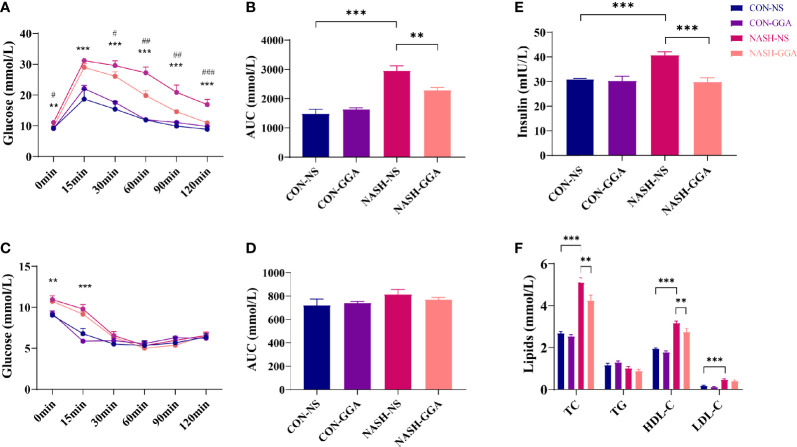
GGA improved insulin resistance and glucose intolerance in MAFLD mice. (A) Blood glucose at each time point during ip. GTT, *CON-NS vs. NASH-NS, #NASH-NS vs. NASH-GGA. (B) Area under the curve of glucose for ip. GTT. (C) Blood glucose at each time point during ip. ITT, *CON-NS vs. NASH-NS, #NASH-NS vs. NASH-GGA. (D) Area under the curve of glucose for ip. ITT. (E) Comparison of fasting serum insulin levels between the groups. (F) Comparison of lipid profile in each group. Data are presented as mean ± SEM. The significance among the groups was determined using the two-way ANOVA with LSD’s multiple comparisons test (n = 4 in CON-NS group, n = 6 in CON-GGA group, n = 7 in NASH-NS group, n = 7 in NASH-GGA group), *,# p < 0.05, **,## p < 0.01, ***,### p < 0.001.

