
Figure 4. Association of the LCT locus (rs182549) with the genus Bifidobacterium.
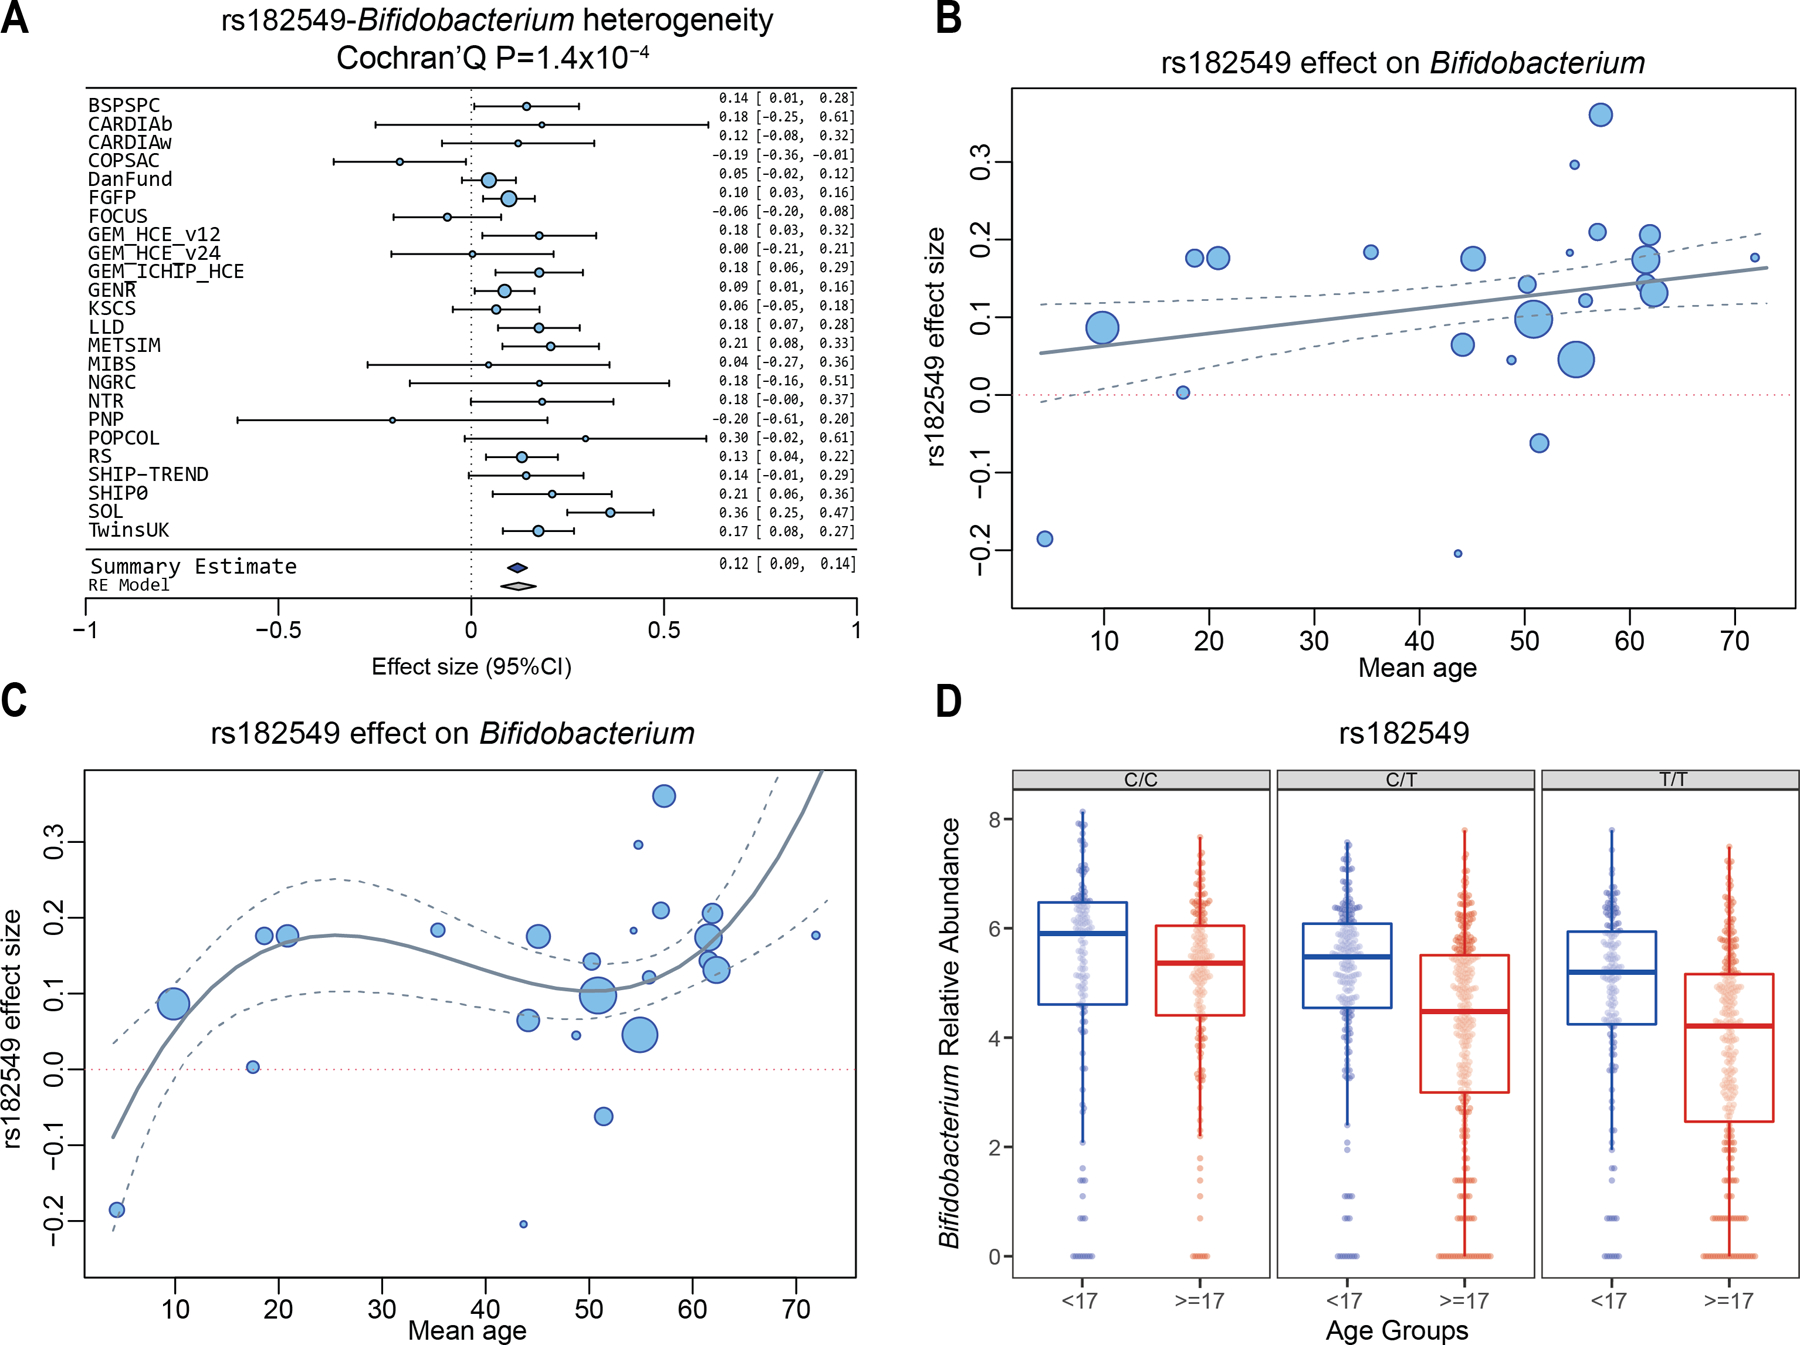
(a) Forest plot of effect sizes of rs182549 and abundance of Bifidobacterium. Effect sizes and 95% CI are defined as circles and error bars. Effect sizes were calculated from Spearman correlation p-values (Online Methods). (b) Meta-regression of the association of mean cohort age and mbQTL effect size. Confidence bands represent the standard error of the meta-regression line. (c) Meta-regression analysis of the effect of linear, squared and cubic terms of age on mbQTL effect size. Confidence bands represent the standard error of the meta-regression line. (d) Age-dependence of mbQTL effect size in the GEM cohort. Blue boxes include samples in the age range 6–16 years old. Red boxes include samples with age ≥17 years. The C/C (rs182549) genotype is a proxy of the NC_000002.11:g.136608646=(rs4988235) allele, which is associated to functional recessive hypolactasia. The central line, box and whiskers represent the median, IQR and 1.5 times the IQR, respectively. See Supplementary Note for cohort abbreviations.