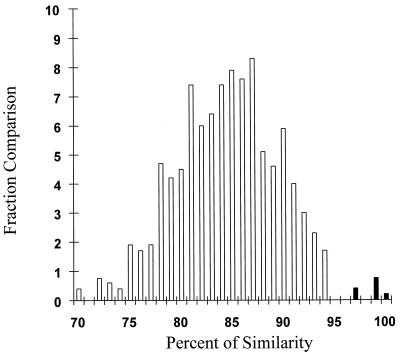
FIG. 1.
Distribution of nucleotide similarities within HGV sequences. For this analysis, the percentage of nucleotide distances was rounded off to the nearest percentage, and the total number of pairwise comparisons (y axis) with a given similarity was represented as a histogram. Each sequence was compared to every other sequence. Black bars represent the percent similarity among mother-child pairs (7, 11, and 14) in which vertical transmission occurred.

