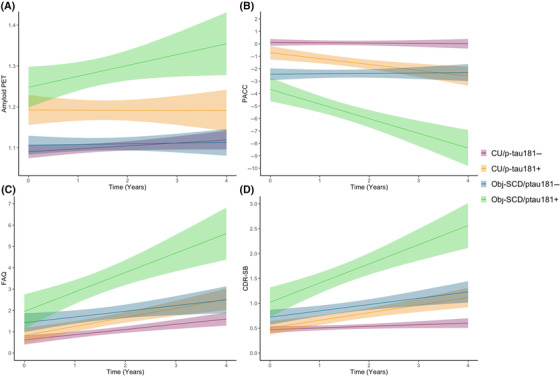
FIGURE 3.

Trajectories of amyloid, cognition, and everyday function by baseline cognitive group/plasma p‐tau181 positivity classifications over 4 years. Model‐predicted values are shown for (A) amyloid positron emission tomography (PET) results, (B), modified Preclinical Alzheimer Cognitive Composite (PACC) scores, (C) Functional Activities Questionnaire (FAQ) scores, and (D) Clinical Dementia Rating–Sum of Boxes (CDR‐SB) scores, adjusted for age, sex/gender, apolipoprotein E ε4 allele frequency, and pulse pressure. The amyloid PET model is also adjusted for baseline amyloid level, and the PACC, FAQ, and CDR‐SB models for years of education. Shaded areas represent 95% confidence intervals. CU/p‐tau181–, cognitively unimpaired, p‐tau181‐negative; CU/p‐tau181+, cognitively unimpaired, p‐tau181‐positive; Obj‐SCD/p‐tau181–, objectively‐defined subtle cognitive decline, p‐tau181‐negative; Obj‐SCD/p‐tau181+, objectively‐defined subtle cognitive decline, p‐tau181‐positive.
