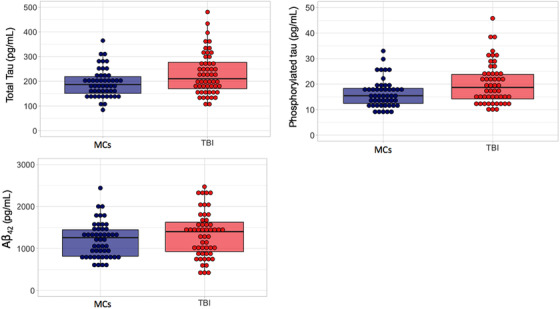
FIGURE 1.

Group comparisons on cerebrospinal fluid (CSF) protein markers of amyloid beta (Aβ)42 and total tau (t‐tau) or tau phosphorylated at the threonine 181 positionp‐tau. Top left panel depicts significant group differences in CSF levels of t‐tau (left) versus right top right shows p‐tau (right). Bottom row depicts Aβ levels between the two groups
