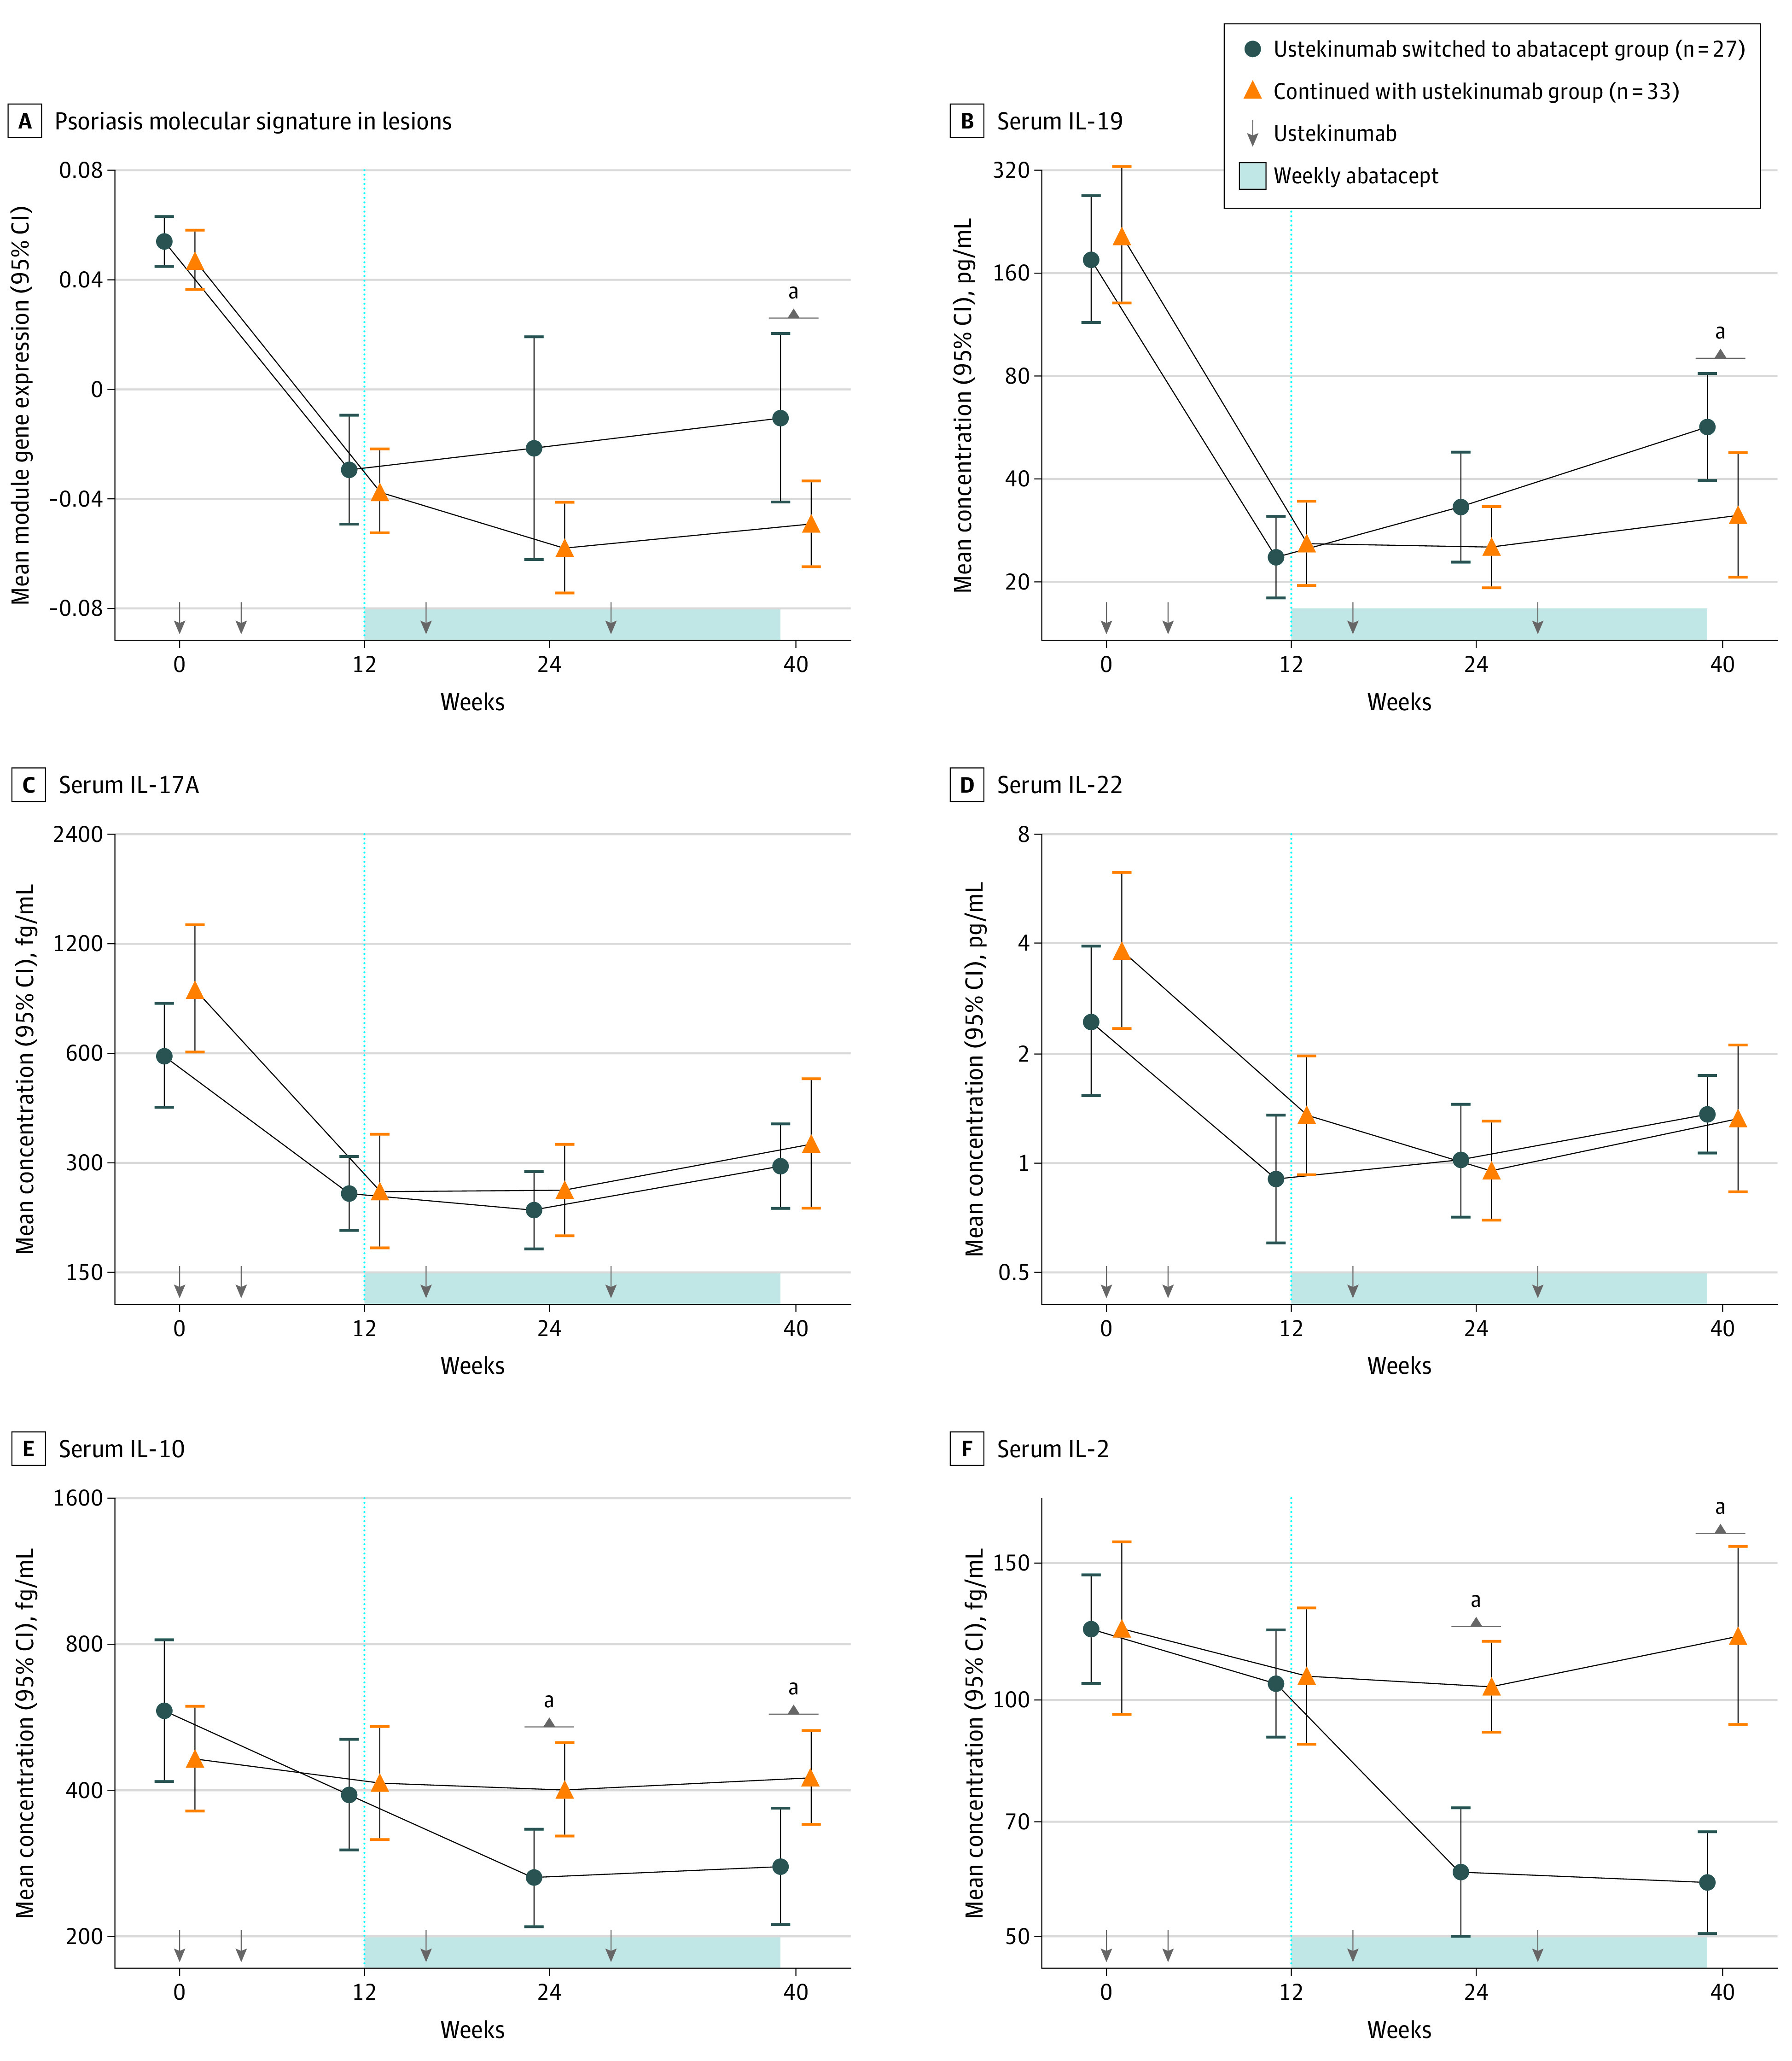
Figure 4. Suppression of the Psoriasis Molecular Signature in Resolving Lesions and Serum IL-19 Levels After Ustekinumab Withdrawal in Participants Who Completed Treatment.

A, Line plot shows the eigengene (weighted mean expression of genes in the psoriasis molecular signature module) value for lesions at week 0 and resolving lesions at weeks 12, 24, and 40 by treatment group. B to F, Line plots show the mean concentration of interleukin (IL)–19, IL-17A, IL-22, IL-10, and IL-2 levels in serum at weeks 0, 12, 24, and 40 by treatment group. Error bars display the 95% CIs. P values between treatment groups were determined by mixed model for repeated measures with baseline adjustment.
aSignificant difference (P < .05) between treatment groups.
