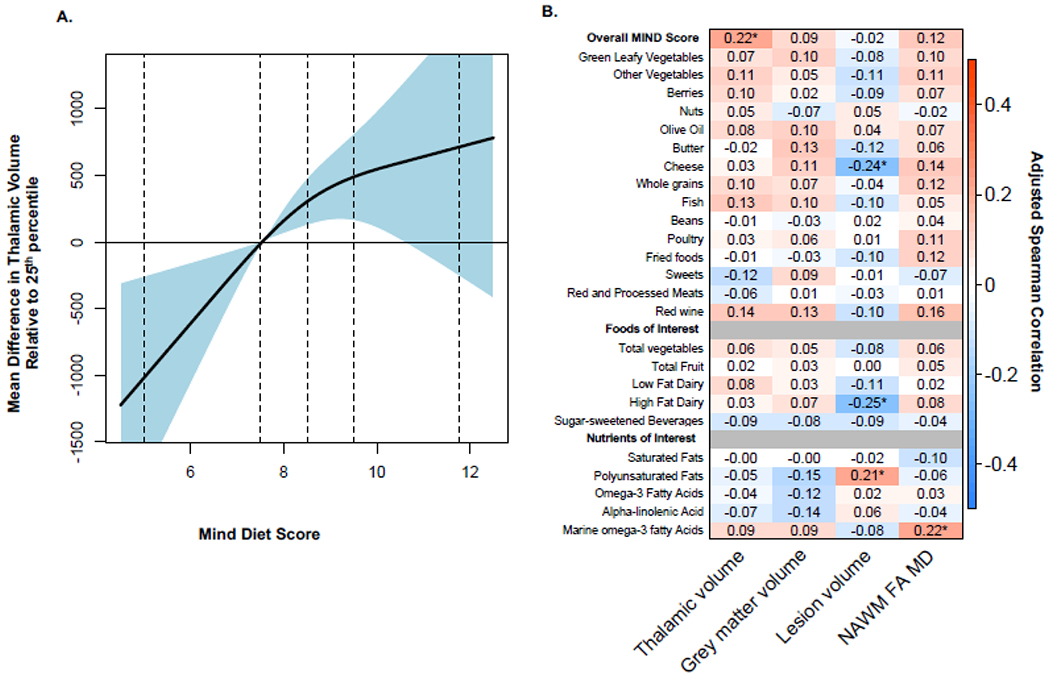
Figure 1.

Overall MIND Diet Score, Components, Foods and Nutrients and MRI Outcomes
A. The association between overall MIND diet score and thalamic volume using restricted cubic splines. Plotted values denote the mean difference in thalamic volume for an increase or decrease in MIND diet score relative to the 25th percentile (scores of 7.5). Curves are additionally adjusted for age, sex, race, ethnicity, socio-economic status, physical activity, BMI, smoking status, disease duration, disease modifying therapy use and class, and total energy intake. Vertical dotted lines denote the 2.5th, 25th, 50th, 75th and 97.5th percentile of MIND diet scores. B. Adjusted Spearman correlations between overall MIND diet score, components, foods, and nutrients of interest and MRI outcomes. Spearman correlations are adjusted for age, sex, race, ethnicity, socio-economic status, physical activity, BMI, smoking status, disease duration, disease modifying therapy use and class, and total energy intake. The “*” denotes p-values <0.05.
