Abstract
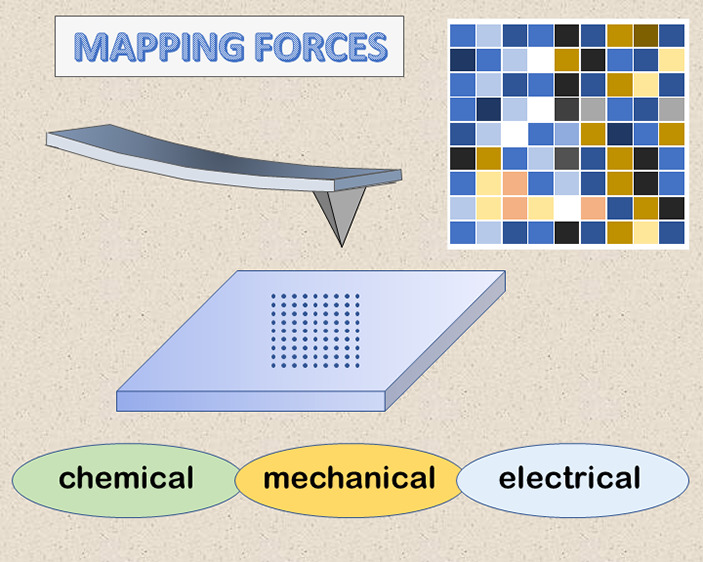
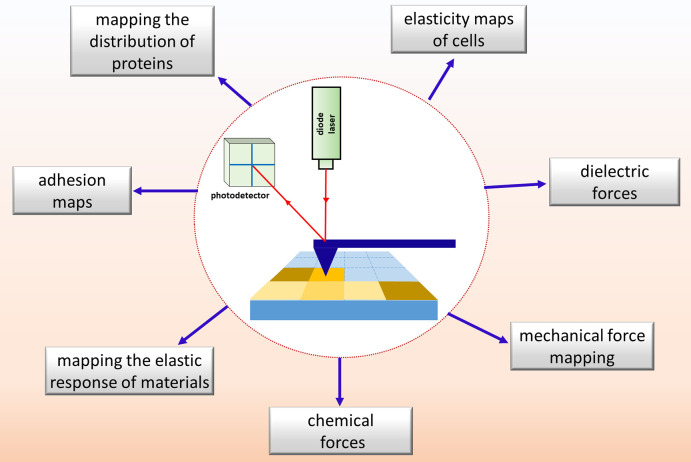
Information of the chemical, mechanical, and electrical properties of materials can be obtained using force volume mapping (FVM), a measurement mode of scanning probe microscopy (SPM). Protocols have been developed with FVM for a broad range of materials, including polymers, organic films, inorganic materials, and biological samples. Multiple force measurements are acquired with the FVM mode within a defined 3D volume of the sample to map interactions (i.e., chemical, electrical, or physical) between the probe and the sample. Forces of adhesion, elasticity, stiffness, deformation, chemical binding interactions, viscoelasticity, and electrical properties have all been mapped at the nanoscale with FVM. Subsequently, force maps can be correlated with features of topographic images for identifying certain chemical groups presented at a sample interface. The SPM tip can be coated to investigate-specific reactions; for example, biological interactions can be probed when the tip is coated with biomolecules such as for recognition of ligand–receptor pairs or antigen–antibody interactions. This review highlights the versatility and diverse measurement protocols that have emerged for studies applying FVM for the analysis of material properties at the nanoscale.
Introduction
Force–volume mapping (FVM) is a characterization mode of scanning probe microscopy (SPM) that is used to map material properties, which can be correlated directly with successively acquired topography images. Scanning probe microscopy encompasses a family of nanoscale measurements which use a microfabricated probe for sample characterizations. The term atomic force microscopy (AFM) is commonly used to describe SPM protocols for imaging surface morphology with nanoscale resolution and has also been referred to as scanning force microscopy. To accomplish FVM, an array of force measurements is obtained point-by-point in a grid pattern, using an approach developed by Radmacher et al. in 1994.1 Properties that have been measured with FVM include adhesive forces, viscoelasticity, elastic modulus, chemical forces, dielectric conductance, and electrical properties. The grid of measurements can be compared directly with topography images to generate a 3D volume map. Unfortunately, the FVM mode usually requires longer acquisition times than conventional SPM imaging, which has limited the broad application of this characterization approach.
Typically, FVM is accomplished by acquiring multiple measurements of forces or material properties along a defined grid of points within a selected 3D region of a sample, as depicted in Figure 1. An AFM probe is used for mapping tip–sample forces and for characterizing topography features, and resolution at the atomic level can routinely be achieved. Features within the corresponding topography frames can be correlated with FVM measurements to provide insight of structure/property interrelationships with nanoscale resolution. Data related to height, stiffness, tip–sample adhesion, energy dissipation, and mechanical or electrical properties can be mapped for samples using FVM, with instrument operation in ambient air, liquid media, or vacuum environments.
Figure 1.
With FVM, grid areas defined to map sample properties for comparison to surface features. Individual measurements are acquired within each pixel of the volume area to obtain local information on sample properties.
In this review, we describe how FVM has been applied for characterizing multiple types of materials, ranging from biological samples to polymers and inorganic solids. Measurements of nanomechanical properties have been widely reported for biological samples; however there are also studies which used FVM to characterize organic films, inorganic materials, and polymer films. Measurement protocols and example studies will be described for FVM, to provide a fresh perspective about the capabilities and limitations of this highly versatile measurement tool.
Volume Mapping with Force–Distance Curves
Two-dimensional force volume maps can be constructed by collecting multiple force curves over selected areas of a sample within a defined grid. Force–distance curves are a graphical representation of the applied force versus the tip–sample distance and are acquired by monitoring the cantilever deflection and piezo displacement during an approach–retract cycle of the probe.2 Force spectroscopy has been broadly applied to evaluate properties such as elasticity, stiffness, and adhesion at the nanoscale.3
Force curves obtained with the force–volume mode are converted by post-processing, using software algorithms to extract force–indentation curves. The force, F, is a function of the piezo displacement, z, and can be expressed as
| 1 |
The spring constant, k, is determined by the geometry of the SPM tip and Young’s modulus, E, of the cantilever material, expressed as follows:
| 2 |
These equations can be used to derive the spring constant for tips that have a rectangular geometry for the cantilever, with variables w = width, t = thickness, and l = length. Young’s modulus can be derived from k. For force curves that have a linear approach, k can be derived experimentally from the slope of the curves.
For FVM mode, multiple force curves are acquired at points of a defined grid pattern. The interactions between the tip and sample are measured locally and mapped point-by-point for a defined 3D region using force–distance curves. An example profile for an approach–retreat cycle is shown in Figure 2, which plots the tip deflection as a function of the tip–sample distance. The approach curve is highlighted in red, and the retraction is profiled in blue. Starting from the right there, is no interaction between the tip and sample initially (red line), which indicates zero force when the tip is far away from the surface. As the probe is brought closer to the sample, the tip will “snap-in” to touch the surface due to attractive forces. The contact line is shown on the left side of the plot for both the approach and retract portions of the curve, and typically there is a slight hysteresis which is revealed by the separation of the two lines. The region for the “jump-from-surface” is indicated when the tip deflection is negative (blue line); this portion of the curve is used to measure adhesion forces. Strong adhesion can result from the capillary force of surface films of water, particularly when measurements are made in humid environments. The magnitude of the adhesion can be reduced by imaging in liquids. After the tip has been lifted from the sample, the deflection returns to zero at the right side (blue line), indicating the tip is no longer in contact with the sample.
Figure 2.
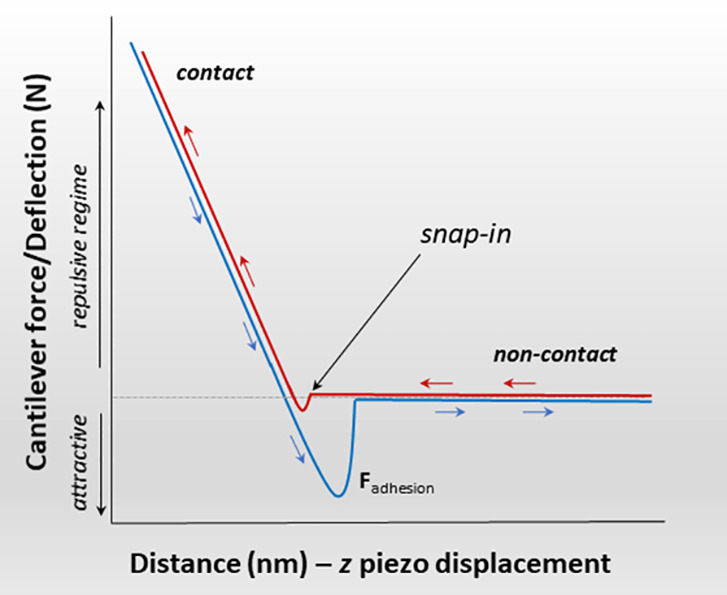
Profile of a force–distance cycle measured with SPM. The approach curve is highlighted in red, and the retract curve is outlined in blue. The black arrow indicates the jump-to-contact point where the tip snaps in to touch the surface.
Example parameters that have been used with FVM, such as the grid sizes and types of probes which have been applied for studies of diverse sample materials are summarized in Table 1.4 Experimental factors such as the imaging environment, temperature, and type of probe provide flexibility for designing experiments. For example, dynamic changes for samples can be evaluated by careful selection of the pH, temperature, or ionic strength or from the nature of the solvents used as imaging media. For FVM studies, typically, a square grid is defined, with 16–256 points tested in the x and y directions. The sizes of the areas that are mapped range from nanometers to several micrometers, to be chosen according to the nature of the sample.
Table 1. Examples of the Multiple Parameters That Have Been Used Successfully for FVM Studies with Force–Distance Curves.
| samples studied | forces measured | substrate | imaging media | SPM probe | grid size | mapped area | ref |
|---|---|---|---|---|---|---|---|
| epithelial cells | force–distance elastic response indentation | glass | salt solution, rt and 37 °C | Si3N4, k ∼ 0.03 N/m | 64 × 64 | 10 × 10 μm2 | (4a) |
| 32 × 32 | 30 × 30 μm2 | ||||||
| diacetylene thiols, before and after polymerization | frictional forces vs applied load | Au(111) | dry nitrogen environment, rt | silicon, k ∼ 0.2 N/m | 16 × 16 | 250 × 250 nm2 | (4b) |
| lactic acid bacteria imaged in buffer | tip adhesion to bacterial strains | poly-l-lysine-coated glass | KH2PO4 buffer, pH 7, 20 °C | Si3N4k ∼ 0.06 N/m | 32 × 32 | 1 × 1 μm2 | (4c) |
| nanobubbles formed by argon in HOPG | interaction forces with approach–retract cycles | HOPG | water | Si3N4, k = 0.05 N/m | 32 × 32 | 5 × 5 μm2 | (4d) |
| bacterial cells with or without capsules | tip–sample adhesion, elastic response | glass | PBS buffer | Si3N4, k ∼ 0.1 N/m | 16 × 16 | 300 × 300 nm2 | (4e) |
| cancerous epithelial breast cells | force–distance superimposed with optical images | glass | cell culture medium | ?? | 256 × 256 | 30 × 30 μm2 | (4f) |
| lysozyme | force–distance attractive and adhesive forces | mica | acetate buffer (10 mM), pH 4.0 | Si3N4, k ∼ 0.32 N/m | 100 × 250 | 500 × 500 nm2 | (4g) |
| biomimetic membrane triblock copolymer film | interaction forces (snap-in) indentation | polymer: ethylene tetrafluoro- ethylene | Milli-Q water | Ag2Ga, k = 6 N/m;Si, k = 2 N/m | 20 × 20 | 80 ×80 μm2 | (4h) |
| 30 × 30 | |||||||
| graphene exposed to laser irradiation | adhesion (pull-out forces) | silica | rt, 30–35% humidity | Si3N4, k = 0.8 ± 0.2 N/m | PF-KPFM | 2–5 μm2 frames | (4i) |
The elastic and adhesive properties of pathogenic bacteria, Streptococcus pneumoniae (S. pneumoniae) and S. mitis, were investigated using FVM, as reported by Marshal et al.4e Force-curve profiles were obtained for the center and edge areas of individual bacterial cells in PBS buffer, to evaluate the mechanical properties for cells containing a polysaccharide capsule compared to unencapsulated cells. The retraction curves from force volume maps were used to calculate the adhesion force between an AFM tip and bacterial cells for the strains, as shown in Figure 3 with FVM maps of the central areas of individual bacterium. Adhesion is the amount of force required to pull the tip away from the surface and was reported to measure less than 1 nN for each pull-off event, during retract cycles of force curves. Distinct force profiles were measured for each bacterial strain, shown in Figure 3A–E. The tip did not adhere well to the unencapsulated samples (Figure 3B,D). The strongest adhesion was measured for the S. mitis wild-type bacterium encapsulated with the SK142 strain, shown in Figure 3C. Such studies provide information on the adhesion of bacteria to host surfaces which can be correlated with biochemical structure.
Figure 3.
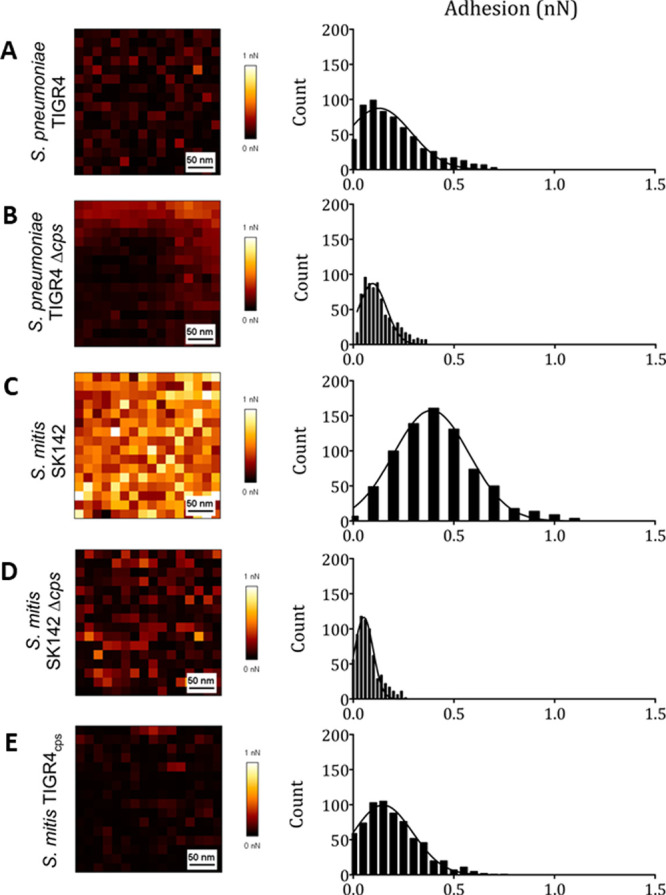
Force volume maps and adhesion curves of bacteria for encapsulated and unencapsulated cells. Areas at the center of the bacterial cells were mapped over a 300 × 300 nm2 area. Maps and distribution of adhesive forces for samples of bacterial strains: (A) Streptococcus pneumoniae (S. pneumoniae) functionalized with TIGR4; (B) unencapsulated Streptococcus pneumoniae with TIGR4; (C) wild type S. mitis (SK142); (D) unencapsulated S. mitis wild type (SK142); (E) capsulated S. mitis functionalized with TIGR4. Reprinted with permission from ref (4e). Copyright 2020 American Chemical Society. .
Force–distance measurements with FVM were used to examine self-assembled monolayers (SAMs) of diacetylene thiol before and after polymerization, as reported by Wu et al.4b Thiol-terminated polydiacetylenes have conjugated backbones that can be polymerized on surfaces by exposure to UV radiation. Investigations with FVM were used to compare the load-dependent frictional behavior of the diacetylene SAMs before and after polymerization. Contact mode AFM was used to map areas that measured 250 × 250 nm2 with FVM (16 × 16 grids) to construct friction versus load curves for samples. Studies revealed changes in local ordering and frictional response after polymerization.
Elasticity and adhesion force maps were acquired for several strains of lactic acid bacteria by Schaer-Zammaretti and Ubbink.4c Force–distance curves (32 × 32 FVM grid) were obtained with silicon nitride nanoprobes at an applied force of 1 nN for areas measuring 1 × 1 μm2. Samples were studied in saline buffer, with controlled pH to compare differences for strains of Lactobacillus. Force maps were found to correlate with cell morphology and heterogeneities of surface constituents such as proteins and polysaccharides.
A biomimetic membrane comprised of a triblock copolymer film with blocks of poly(dimethylsiloxane) and poly(2-methyloxazoline) was studied using FVM by Rein et al.4h Force maps of the snap-in adhesion were mapped for the fluid membrane using two types of AFM probes, over an area of 80 × 80 μm2. Commercial probes having a tetrahedral geometry with a force constant of 2 N/m were compared against ultrasharp silver/gallium probes with a force constant of 6 N/m. Fewer artifacts were detected for the nanoneedle probes made of silver/gallium.
The mechanism and dynamics of surface adsorption of hen-egg-white lysozyme to mica substrates was investigated in situ using FVM and tapping mode AFM, by Kim et al.4g Time-lapse images revealed changes over time for lysozyme adsorption onto mica from an aqueous solution (2 μg/mL). Force–volume mapping was used to evaluate tip–sample interactions for distinguishing areas of protein clusters compared to uncovered substrate.
Analysis and Post-processing of FVM Results
For data acquisition with FVM, each point (or pixel) of the FVM image grid contains 3D position information on xyz coordinates, as well as the approach and retract portions of force measurements. After collecting measurements with FVM, features from topographic images can be correlated with force curves acquired at each pixel of a defined grid volume. For a particular point of the grid, the values of xyz coordinates will provide data for volume, alongside the changes for cantilever deflection. Depending on the size of the grid, the data files can be quite large for subsequent analysis or postprocessing. Real-time or postprocessing of each data point of the FVM grid is used to extract information from force curves by using software programs or designed algorithms.5 A number of programs are available for analysis of FVM, data and key features of several such programs are summarized in Table 2.6 Vendor-sourced software packages for commercial instruments have been developed for real-time analysis of measurements. There are also open source programs such as Gwyddion, Scanning Probe Image Processor (SPIP), and Profilm Online which have been used for postprocessing with FVM microscopy images.
Table 2. Software Programs Used for Real-Time and Post-processing of FVM Data.
| software program | FVM analysis tools | source | ref |
|---|---|---|---|
| Gwyddion | force and indentation volume data processing statistical functions | Open-Source | (6a) |
| Profilm Online | digital image processing image analysis | Film Metrics | (6b) |
| Scanning Probe Image Processor (SPIP) | Young’s modulus mapping force-curve analysis force volume analysis | Image Metrology | (6c) |
| Quantitative Imaging (QI) | adhesion, stiffness, dissipation | JPK Instruments | (6d) |
| FC_Analysis | force-curve map analysis | Open-Source | (6e) |
| Gnome X Scanning Microscopy project (GXSM) | plug-ins for mathematical operations | Open-Source | (6f), (6g) |
| PeakForce Quantitative Nanomechanical Mapping (PF-QNM) | mapping chemical, mechanical, biological interactions, quantitative modulus measurement | Bruker | (6h), (6i), (6j), (6k) |
| Igor Pro | image post-processing mathematical functions statistical analysis | Wave Metrics | (6l) |
| Pinpoint Nanomechanical Mode (real time) | stiffness, elastic modulus, adhesion force | Park Systems | (6m), (6n) |
| Fast Force Mapping Mode (real time) | force–distance measurements modulus adhesion | Oxford Instruments Asylum Research | (6o) |
| NanoMech Pro (real time) | force-curve analysis phase imaging force modulation | Oxford Instruments Asylum Research | (6p), (6q) |
| HybriD Piezoresponse Force Microscopy | nanomechanical, adhesive piezoresponse properties, electromechanical forces | NT-MDT | (6r) |
| Pulsed Force Mode | elastic, electrostatic, stiffness adhesive properties | WiTec | (6s) |
Instrument manufacturers have developed multiple approaches to accomplish rapid positioning and acquisition of data for FVM characterizations. As the tip is brought in and out of contact with the surface, rich information of sample properties can be acquired in real time for point-by-point comparison to topographic features. For example, the Pulsed Force Mode (WiTec) can be applied using scanning speeds that are comparable to contact mode imaging for SPM studies with chemical force microscopy, electrostatic force imaging, electrochemistry, and adhesion measurements for operation in air or in fluids.6s The nanomechanical measurement modes of conventional FVM, Quantitative Imaging (QI), and PeakForce Quantitative Nanomechanical Mapping (PF-QNM) were compared for bacterial the samples by Smolyakov et al.7 All of the three modes, (FVM, QI, and PF-QNM) were found to provide consistent results for studies of the morphology and elastic modulus maps of living Pseudomonas aeruginosa bacterial cells; however, shorter acquisition times and higher resolution were considered to be advantages with the QI and PF-QNM modes.
Probing the Nanomechanical Properties of Biological Samples with Force–Volume Mapping
The mechanical properties of biological samples such as tissue and cancer cells, amyloid fibrils, and bacteria have been measured using FVM to furnish insight into the elastic response and to be correlated with morphology. For example, FVM has been used to probe the development of several types of cancer including liver, cervical, breast cancer, and metastatic tumors residing in the brain.8 The progression of a normal cell to become a metastatic cancer cell follows complex structural changes in the extracellular matrix and cellular architecture, which can be studied at the level of individual cells using the FVM mode.
A sample of breast cancer cells was examined by FVM which revealed that healthy breast cells, benign cancer cells, and metastatic cancer cells each display a distinct mechanical signature of stiffness properties, as reported by Plodinec et al.8c The progression of a normal cell to become a metastatic cancer cell follows complex structural changes in the extracellular matrix and cellular architecture. Stiffness measurements at the level of individual cells were examined by FVM, which revealed that healthy breast cells, benign cancer cells, and metastatic cancer cells each display a unique profile of elastic modulus; shown in Figure 4. Healthy cells isolated from a breast biopsy and benign breast cancer cells presented a uniform stiffness characterized by a single distinct peak for values plotted with 24 × 24 pixel maps, whereas malignant cancer cells displayed a broadened distribution of measurements with lower values for the elastic modulus. The histogram of the distribution of measurements for healthy cells isolated from a breast biopsy exhibited a unimodal stiffness distribution of 1.13 ± 0.8 kPa (Figure 4A), and the benign breast cancer biopsy sample exhibited a stiffer and broader unimodal distribution of 3.68 ± 1.92 kPa (Figure 4B). The metastatic cancer biopsy displayed a bimodal distribution of stiffness (Figure 4C), with two prominent peaks at 0.57 ± 0.16 kPa (first peak) and 1.99 ± 0.73 kPa (second peak).
Figure 4.
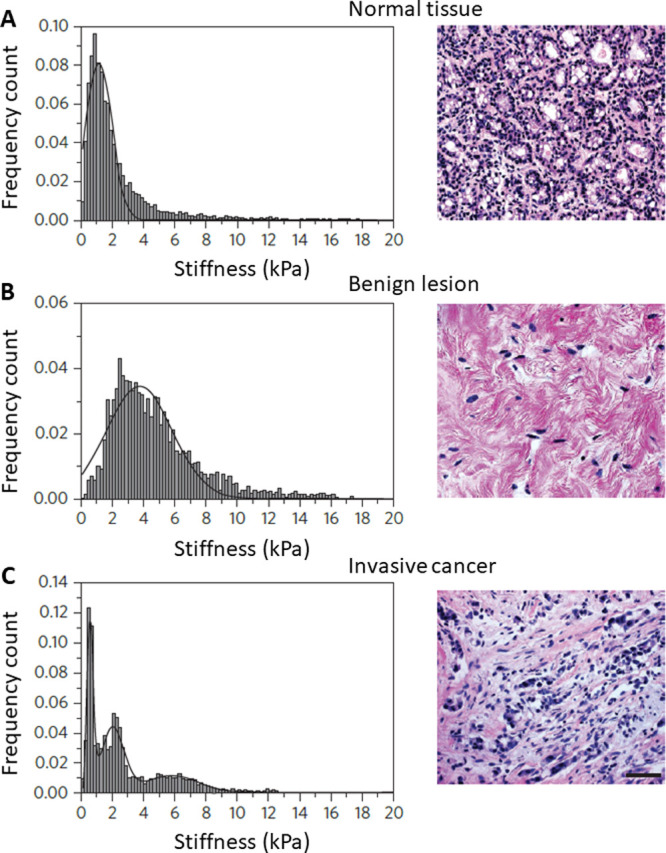
Stiffness measurements obtained using FVM mode for samples of breast tissue. Optical micrographs of a stained tissue and distribution of elastic modulus measurements are shown for (A) healthy tissue and (B) benign and (c) metastatic cancer cells. Tissues were treated with hematoxylin and eosin stain: nuclei are stained blue, and the extracellular matrix along with the cytoplasm is stained pink. Reprinted with permission from ref (8c). Copyright 2012 Springer Nature.
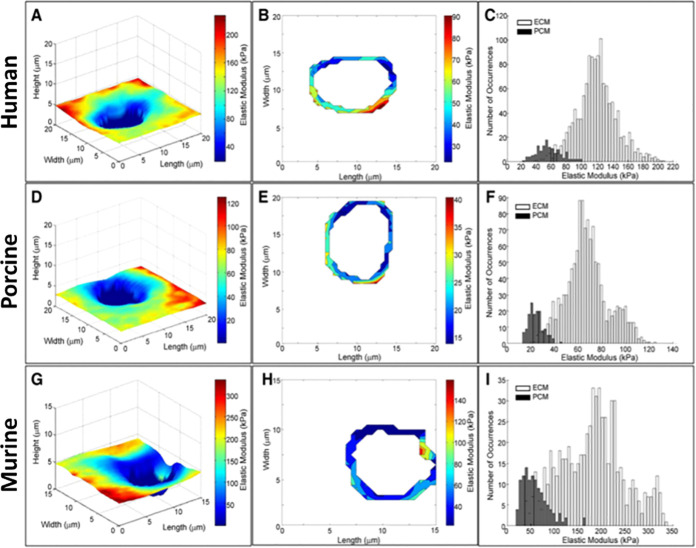
The mechanical properties of articular cartilage of human, porcine, and murine samples were investigated using FVM mode by Darling et al.; example results are presented in Figure 5.9 The AFM probe was modified with a borosilicate glass sphere to map the site-specific elastic modulus for sectioned tissue samples of articular cartilage. The pericellular matrix (PCM) of the articular cartilage was shown to be biochemically and structurally distinct from the extracellular matrix (ECM), and samples of human, porcine, and murine, which differed significantly in stiffness when comparing maps of elastic modulus. Stiffness differences for cartilage from human (Figure 5A–C), porcine (Figure 5D–F), and murine (Figure 5G–I) samples are compared with an overlay of topography and elasticity maps (left) and analysis plots (center and right). Within regions of interest located in light microscopy images, 16 sites/region were sampled to generate 900–1600 indentation sites. An example test site from each sample (Figure 5A,D,G) is displayed as a combined topography/FVM image. The distribution is presented using the compression behavior of amyloid fibrils for radially applied force that was examined using FVM histograms (Figure 5C,F,I). A combined topography/FVM image and the contour maps (Figure 5B,E,H) show the location of areas of the PCM that were sampled. A comparison of the distribution of the elastic moduli measurements for the PCM and ECM is represented in histograms (Figure 5C,F,I), showing that the PCM is characteristically less stiff than the ECM, and the distribution of elastic moduli values is notably broader for the ECM than for the PCM.
Figure 5.
Comparison of stiffness measurements measured with FVM for sectioned tissue samples of articular cartilage from human (top row), porcine (middle row), and murine (bottom panels). Topography images are shown with an overlay of FVM elasticity maps (left column: A, D, and G). Contour maps of the elastic moduli of the pericellular matrix are shown for multiple regions that were tested (center column: B, E, and H). Histograms of elastic moduli reveal a bimodal distribution (right column: C, F, and I). The black peaks of the histograms correspond to the pericellular matrix with low modulus values, and the white bars indicate regions of the extracellular matrix with higher elastic modulus. Reprinted with permission from ref (9). Copyright 2010 Elsevier. .
Investigations with FVM were used to study the stiffness of the outer membrane of individual bacterial cells of Escherichia coli by Longo et al.10 Commercial probes with nominal spring constants of 0.06 N/m were used to acquire indentation measurements within scan areas of 2, 5, and 10 μm regions. An example image for an area containing four bacterial cells is revealed in the topography frame of Figure 6A. Each pixel of the corresponding FVM image (Figure 6B) represents the sites where force–distance measurements were acquired. Force measurements were converted to values of Young’s modulus using a Hertzian model and is plotted in MPa. The stiffer areas are indicated in yellow-orange-red shades for the color scale, and the blue regions represent lower values.
Figure 6.
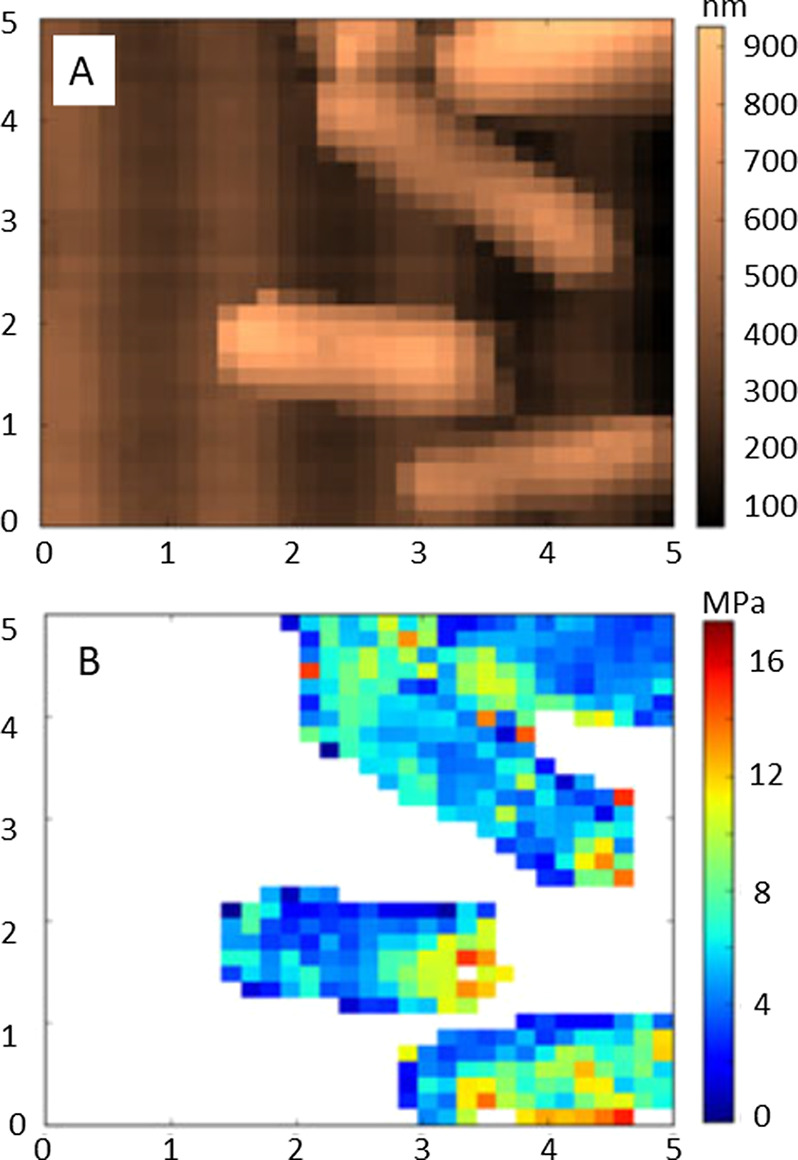
Images of the outer membrane of Escherichia coli cells captured with 32 × 32 pixel resolution. (A) Topography frame; (B) corresponding elastic modulus measurements (5 × 5 μm2 frames) acquired in ambient air. Reprinted with permission from ref (10). Copyright 2012 Wiley. .
The compression elasticity of amyloid fibrils was examined using FVM mode, by Zhou et al.11 For FVM experiments, a glucagon peptide consisting of 29 amino acid residues was chosen for characterization during selected intervals of fibrillogenesis. High resolution images (300 × 300 nm2) of fibrils were acquired for defining areas with 32 × 32 grid maps to measure elasticity changes for three positions along the length of the glucagon fibrils. Structural heterogeneities were revealed for elasticity with comparisons of twisting conformations and fibril thickness.
Measuring the Young’s Modulus of Soft Materials with FVM
Force–volume mapping can be applied to measure the mechanical properties of soft samples at the scale of nanometers with multiple approach–retract cycles, which can then be used to derive highly local measurements of Young’s modulus. Nanomechanical mapping of elastic response using FVM has been applied for sample materials such as biological cells and polymer blends.12 Several models have been employed for calculating elastic modulus values from SPM force curves.13 Strategies for extracting information of the elastic properties from force–distance measurements have been previously described by Bahrami et al.13a and by Lin et al.13d The most widely used models are based on the Derjaguin–Müller–Toporov (DMT)13b and the Johnson–Kendall–Roberts (JKR) models that describe relationships between the applied force, adhesion force, and the tip radius for calculations of nanomechanical properties.13c Both the DMT and JKR approaches are extensions of the Hertzian model for contact mechanics, which describes adhesion forces between contacting areas.
The Young’s modulus of bacterial samples was measured using FVM, and example measurements are presented in Figure 7, as reported by Gaboriaud et al.12f A grid map (10 × 10) that was generated with force–volume mode is shown in Figure 7A for a region of the surface of a single bacterial cell. Within the 4 × 4 μm2 area of the digital FVM image, an approach–retract cycle was acquired, and the colors indicate indentation from the deflection of the tip. The brighter square colors correspond to soft areas. Examples of individual force approach and retract cycles are plotted in Figure 7B for four distinct areas of the sample. Regions of the substrate (i, iv) show a linear relationship of hard-wall repulsion when the tip and the sample are brought into contact, which indicates that the substrate is not deformable. For force profiles of regions of the cell (ii, iii) the curve shapes are not linear at low load force and large indentation occurs at high load, which indicated a higher elastic modulus compared to that of the substrate.
Figure 7.
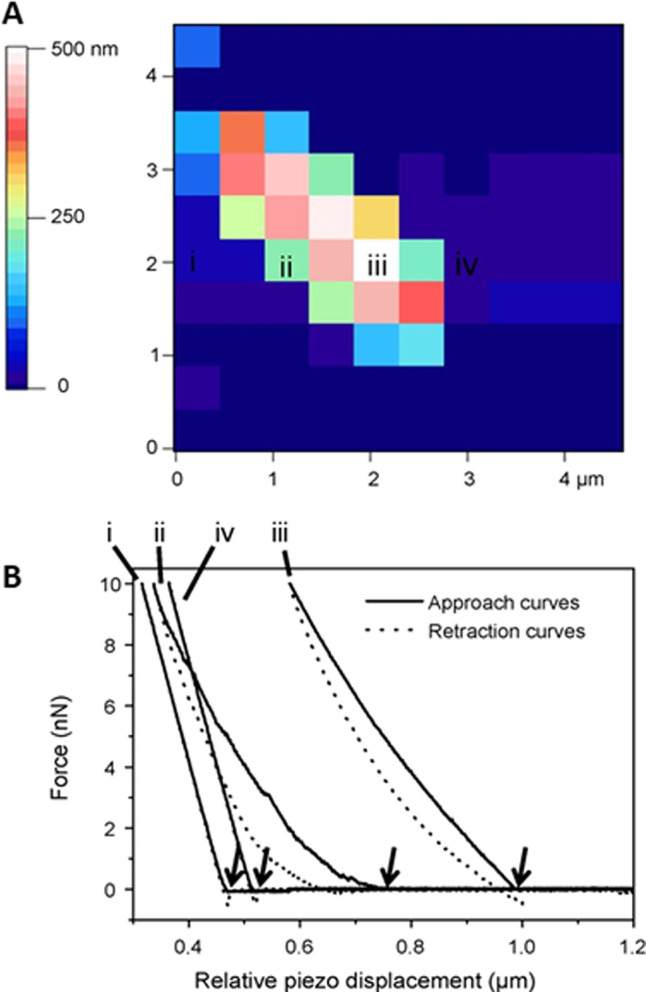
Force–volume data acquired from a sample of an individual bacterial cell measuring interactions between an AFM tip and bacterium. (A) A 10 × 10 grid map of zero-force height values obtained by analyzing each force curve. (B) Approach and retract curves measured on (i) the substrate, (ii) the cell periphery, (iii) the cell apex, and (iv) the substrate. The arrows indicate the corresponding piezo displacement distance for each approach–retract cycle. Reprinted with permission from ref (12f). Copyright 2008 Elsevier.
Dynamic studies with FVM were used to measure the elastic modulus of neuronal soma cells at selected temperatures by Sunnerberg et al.12a Force versus indentation curves were obtained using a spherical AFM tip for samples of soma cells which measured 12 ± 4 μm2 in diameter. A 16 × 16 grid of force versus indentation curves was taken with each cell sample. The indentation curves were fitted with a Hertzian model for a spherical indenter to obtain values of the local elastic modulus. The FVM experiments revealed that the modulus increased with a decrease in temperature, for measurements that were made at 37 and 25 °C.
The effects of glutamate-induced excitotoxicity were studied for neuron cells to evaluate changes for mechanical properties, cell volume, and structure using FVM, by Efremov et al.12b Nanomechanical maps for areas measuring 80 × 80 μm2 were examined with grids of 40 × 40 measurement points that were characterized with a fast force–volume mode. Values of Young’s modulus were calculated by fitting FVM force curves with Hertz’s model. Hyperosmotic stress was applied to the cells by adding sucrose to the cell medium, and time-lapse experiments were conducted to evaluate whether cells recovered from the stress.
Measurement of Young’s modulus was determined quantitatively at the nanometer level using FVM for a sample of a biphasic polymer, by Reynaud et al.12c The biphase polymer system was composed of poly(methyl methacrylate) (PMMA) in a polyacrylate matrix. Indentation measurements were obtained for areas measuring 100 × 100 μm2, with a maximum cantilever deflection setting of 15 nm. The modulus measurements for the polymer blends obtained with FVM were in close agreement with the values measured for control samples of the pure polymers.
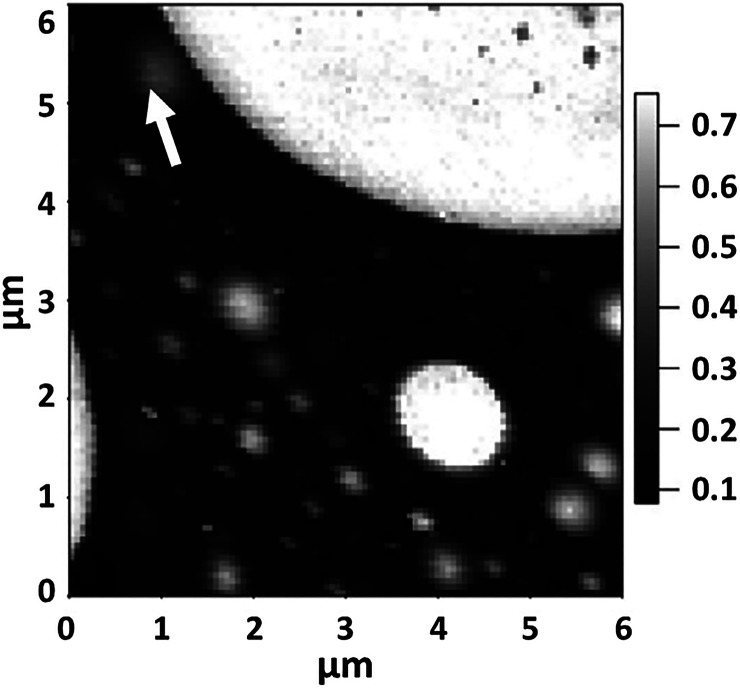
Values of the Young’s modulus of polystyrene–polybutadiene polymer blends were studied using FVM by Krämer et al.12d A stiffness map is shown for a 6 × 6 μm2 area of the polymer film that was acquired with a 100 × 100 force–volume grid (Figure 8A). The brighter white regions correspond to stiffer polymer domains of polystyrene, compared with the softer black regions of butadiene. The arrow points to one of the gray regions of the matrix which has an intermediate stiffness value, between 0.1 and 0.7 MPa. To quantitatively measure Young’s modulus for the sample, force–distance curves were acquired for the blend using a cantilever with a spring constant of 8 N/m and a radius of 110 nm. To calculate values of Young’s modulus, models from both DMT and the JKR theories were used for post-processing of data obtained with force curves.
Figure 8.
Stiffness map acquired using FVM for a triblock copolymer sample consisting of a polystyrene–polybutadiene blend. White areas correspond to stiffer polystyrene domains; black areas are butadiene. The arrow indicates an area of intermediate stiffness. Reprinted with permission from ref (12d). Copyright 2014 Elsevier. .
Mechanical properties of adhesion, stiffness, and dissipation were evaluated for samples of polypropylene using volume mapping with Peak Force QNM, as reported by Voss et al.12e Areas of crystalline isotactic and amorphous elastomer were characterized, and changes were evaluated after steps of wet chemical etching for ablation of surface layers. Maps of force curves were collected for measuring sample properties with a scan rate of 1 Hz (1000–2000 curves/s).14 Force curves were fitted with the DMT model to extract elastic properties. The combination of etching steps with volume mapping provided information of structural defects and inhomogeneities with nanoscale resolution. Peak Force QNM has been applied for studies of nanomechanical properties such as elastic modulus, stiffness, and adhesion for a diverse range of polymer samples such as thermoplastic elastomers, polyamide/polypropylene blends, polysaccharide films, polyamide/fluoroelastomer blends, polycaprolactone fibrils, carbon fiber and poly(ether ether ketone) blends, poly(methyl methacrylate) layers grafted on Ti, and films of polystyrene and poly(methyl methacrylate) blends, as well as for polyamide and cellulose nanofibers.15
Natural diamond AFM probes with steel cantilevers were used for mapping indentation and elastic modulus of an epoxy molding compound using FVM, as reported by Germanicus et al.16 A sample was prepared by incorporating silica beads in epoxy o-cresol novolac resins which are used as plastic packages for automotive, aerospace coatings, and integrated microelectronic devices. Indentation measurements acquired using SPM were compared to measurements acquired using Peak Force QNM at micrometer scales, in which the average values of contact modulus obtained by the two techniques were found to be comparable. The DMT stiffness model was applied to calculate Young’s modulus, and the authors reported higher spatial resolution and surface sensitivity for mechanical mapping for elastic areas of samples as compared to indentation measurements.
Peak Force QNM was used for force–volume mapping with samples of elastomers, thermoplastics, and thermoset resins by Bahrami et al.13a Force curves were evaluated and compared using both the DMT and JKR models. Parameters such as the tip–sample interaction area and contact radius were found to govern the spatial resolution for measuring adhesion forces and elastic modulus.
Mapping Electromechanical Properties with Piezoresponse Force Microscopy
For samples of ferroelectric materials, a mapping mode of piezoresponse force microscopy or PFM has been developed for local characterization of ferroelectric domains.17 The basic principle of PFM is based on detecting the deformation of the sample induced by an electrical bias voltage. For the instrument configuration of PFM, a functional generator is used to apply an oscillating voltage to a conductive probe scanned in contact with the sample, and small deflections of the tip are detected with a lock-in amplifier.18 Local changes of surface volume due to the piezoelectric effect can be evaluated with PFM; however, contributions from electrostriction, electrostatic forces, electrochemical strain, Joule heating, and polarization can complicate analysis and interpretation of measurements.19 The electromechanical properties of a broad range of materials have been studied and mapped with PFM, such as inorganic ferroelectrics, piezoelectric materials, ceramics, and biomaterials.20
Force–Volume Mapping of the Dielectric Properties of Bacterial Cells
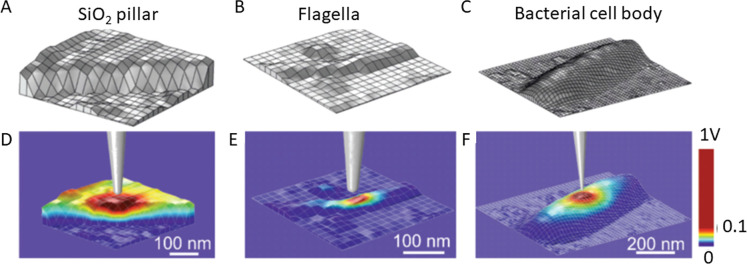
The dielectric constants of bacterial membranes have been characterized using FVM, with spatial resolution at the level of individual cells. For example, bacterial cells of Pseudomonas aeruginosa (P. aeruginosa) were studied in ambient conditions under low humidity (<30%) using FVM to collect measurements of electrostatic forces, as reported by Checa et al.21 A data set of electrostatic force microscopy (EFM) measurements collected with deflection and amplitude approach curves was acquired using an FVM grid of 128 × 128 pixels. Information from FVM data sets was used to identify differences for the dielectric properties of the cell wall and the cytoplasmatic region and to map variations in the dielectric constant along the cell wall of individual bacterial cells. Raw data measurements from tip deflection and oscillation amplitude approach curves were converted into calibrated deflection and capacitance gradient data. A geometric model of measurement grid sites obtained from a topography image is shown in Figure 9A, for an area of a silicon oxide (SiO2) pillar. Examples of the grid maps for a bacterial flagella and cell body are shown in Figure 3B,C, respectively. Corresponding FVM maps for the calculated values of dielectric constants are shown in Figure 9D–F below each topography grid map. The colored regions indicate the potential distributions that correspond to the grid positions underneath the tip. Measurements of dielectric constants were mapped for samples of the flagella and the bacterial cell body of P. aeruginosa. The distribution of the values of the dielectric constant were uniform across areas of the SiO2 pillar and also for the regions of the bacterial flagella. However, the bacterial cell showed a non-uniform distribution of the measured dielectric constants, furnishing information regarding the heterogeneity of cell components. Using approach curves that were acquired with EFM, local maps of dielectric constants were generated by post-processing of data to correspond with images of sample topography.
Figure 9.
Mapping dielectric constants with FVM. Local geometric models from topography images that were used to calculate dielectric properties for (A) a fabricated silicon oxide pillar; (B) an area of a bacterial flagella; (C) central area within the body of a bacterial cell. Maps of the calculated electric potential distributions corresponding to the (D) SiO2 pillar, (E) flagella, and (F) bacterial cell body. Reprinted with permission from ref (21). Copyright 2019 Royal Society of Chemistry.
Maps of the conductivity and interfacial capacitance were acquired with FVM for the semiconducting channel of an organic field-effect transistor (FET) device, as reported by Kyndiah et al.22 Scanning dielectric microscopy in liquid was combined with FVM to acquire electric force images (128 × 26 pixels) of a semiconducting film for regions of the transistor in the on-state. For mapping dielectric properties, a metallic (platinum-coated) probe was used as a gate electrode for the transistor and also for recording electrical forces during operation with FVM in liquid media. The variations in conductivity along the channel attributable to changes in the gate voltage were characterized. Maps of conductivity revealed heterogeneities at micrometer and sub-micrometer scales at the semiconductor/electrolyte interface.
Spatial Mapping of Proteins and Tissues with FVM
Spatial maps of biological samples such as proteins and tissue samples have been acquired with FVM mode to measure forces of adhesion, deformation, and specific chemical binding.23 Experiments with FVM can be accomplished in liquid media such as buffers, to mimic physiological conditions of living cells and to prevent denaturation. Such studies provide insight into the interplay between physiological characteristics and biochemistry at small size scales when imaging individual cells.
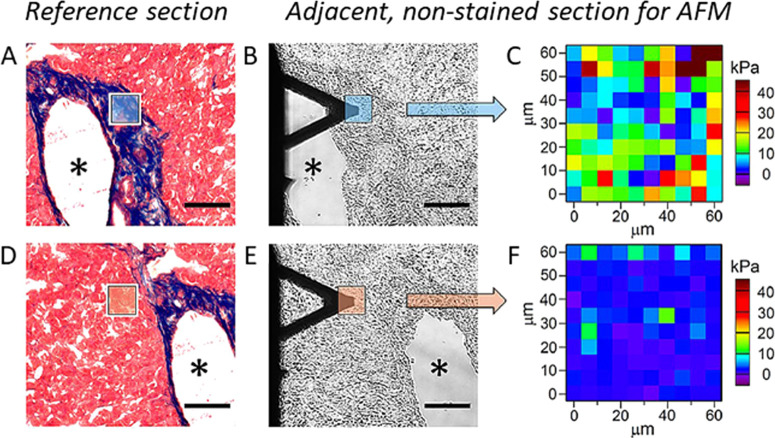
The collagen component in soft organ tissue sections of humans and mice were examined with FVM, to measure elastic properties, as reported by Calo et al.24 Measurements of mechanical properties were found to correlate with the amount and location of collagen in tissue samples that were analyzed with a tandem instrument consisting of an SPM system integrated with bright-field optical microscopy. Example FVM results are shown in Figure 10 for a tissue sample from human liver that was obtained from a patient with colon cancer. Bright-field microscopy images were used to locate certain areas of sectioned tissue for mapping, shown in Figure 10A,B. Maps of elastic modulus were acquired for 60 × 60 μm2 areas, shown in Figure 10C. The deformation of the cantilever obtained with force-curve measurements at each pixel area was used to derive values of Young’s modulus by fitting with contact mechanics models. The mechanical properties were found to correlate with the density of collagen, as revealed by staining in optical microscopy images (Figure 10D,E). Areas of low collagen density are mapped with FVM in Figure 10F. Nonstained optical images of adjacent tissue sections shown in Figure 10B,E indicate the placement of the AFM probe for scanning the framed areas that were mapped with FVM.
Figure 10.
Maps of elastic modulus values compared for areas of collagen-enriched and low collagen areas in frozen-fixed mouse tissue, pinpointed with optical and AFM images. (A) Optical microscopy image of a stained tissue section with low collagen areas indicated in red, and collagen-enriched areas (framed area) stained in blue. The asterisk shows a hollow cavity from a large blood vessel wall as a reference feature. (B) Adjacent, nonstained area of the same tissue sample imaged with bright-field microscopy showing the area scanned with an AFM probe for FVM measurements. (C) Elastic modulus map of the collagen-enriched area framed in panel B. (D) Microscopy image of stained tissue section with low collagen density. (E) Placement of the cantilever tip shown for an unstained section with a bright-field image. (F) Elastic modulus maps of the area with low collagen content shown in panel E. (Scale bar, 100 μm; map size, 60 × 60 μm2; pixel size, 6 × 6 μm2). Reprinted with permission from ref (24). Copyright 2020 Springer Nature.
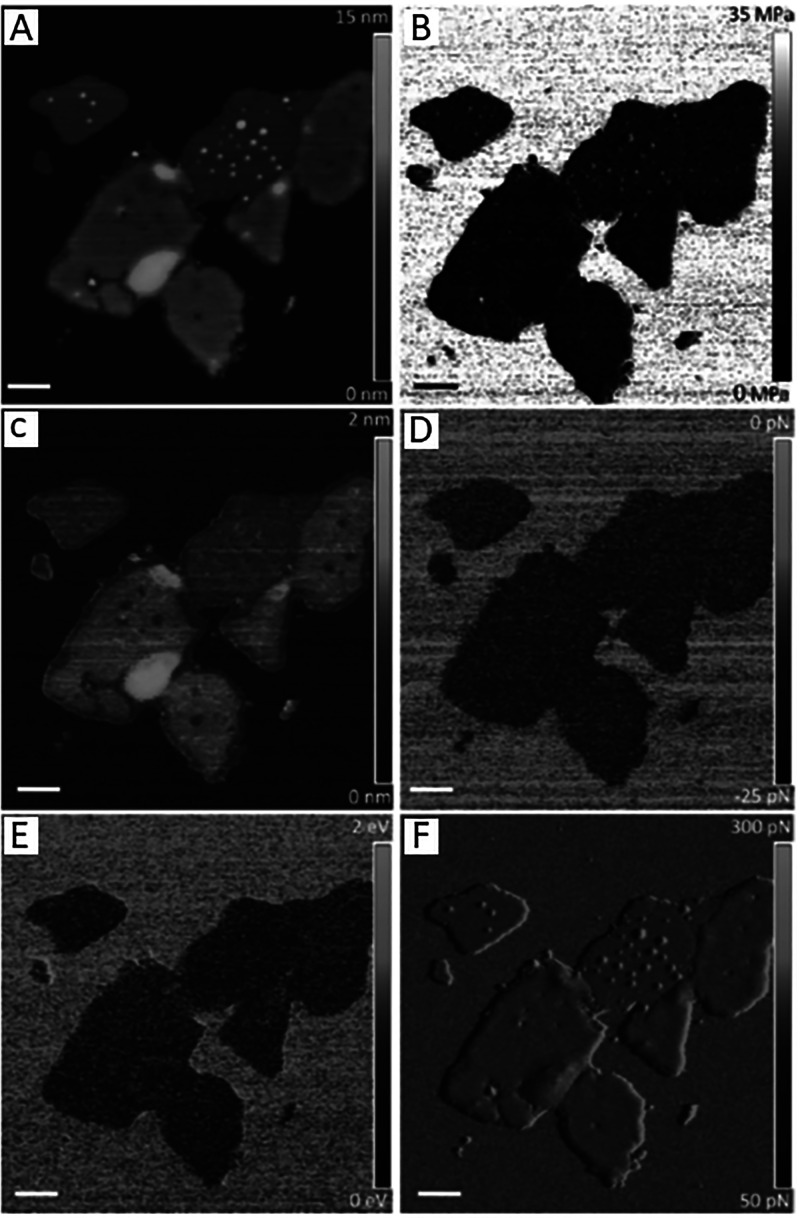
High spatial resolution can be achieved with FVM for measuring chemical and physical properties for samples of the purple membrane of Halobacterium salinarum, as reported by Medalsy et al.23d Purple membranes consist of lipid and a crystalline arrangement of the bacteriorhodopsin protein, which serve as a light driven protein pump. Images of purple membranes are shown with topography (Figure 11A) and corresponding FVM images. Force–distance curves were acquired at each pixel of the topography image (512 × 512 pixel grid) and were subsequently used to extract information of Young’s modulus, sample deformation, adhesion force, energy dissipation, and trigger force error (Figure 11B–F). The trigger force error (Figure 11F) is a measure of the deviation of the instrument feedback loop to adjust the trigger force; the values ranged from 50 to 300 pN. Such experiments showcase the capabilities of FVM mode for mapping and quantifying multiple parameters of chemical and physical properties of biological samples with nanometer resolution.
Figure 11.
Spatial mapping with force modulation mode for a sample of native purple membrane using force-volume mapping in buffer solution. (A) Surface features of purple membrane viewed with a topography image that was used to measure cytoplasmic and extracellular heights. Corresponding maps of (B) Young’s modulus; (C) deformation; (D) adhesion forces between the tip and sample; (E) energy dissipation; and (F) the trigger force error channel. Scale bars are 200 nm. Reprinted with permission from ref (23d). Copyright 2011 John Wiley and Sons.
Chemical Force Microscopy Using FVM with Functionalized Probes
The FVM mode can be used in combination with chemical force microscopy, an imaging strategy in which tips are functionalized to characterize chemically specific interactions with a sample. Multiple approaches have been developed for tip functionalization to design chemically specific tip–sample interactions, and representative examples of tip coatings that have been used with FVM are presented in Table 3.25
Table 3. Coating Materials Used to Functionalize SPM Probes for FVM.
| interactions studied | tip | functional groups | FVM grid | area sampled | ref |
|---|---|---|---|---|---|
| binding force between Concanavalin A and mannan polymers of yeast cells in PBS buffer | gold-coated Si3N4 tip | SH-functionalized protein, Concanavalin A | 16 × 16 | 3 × 3 μm2 | (25a) |
| mapped the distribution of an enzyme on the membrane of nerve cells in salt solutions | gold-coated Si3N4 tip | nerve growth factor attached with a thiolated cross-linker | 32 × 32 | 8 × 8 μm2 | (25b) |
| 4 × 4 μm2 | |||||
| specific interaction between cholera toxin B oligomer and receptor ganglioside in PBS buffer | gold-coated Si3N4 tip | ganglioside (GM1) attached to a thiolated cross-linker | 16 × 16 | 5 × 5 μm2 | (25c) |
| mapped adhesion forces between polar/nonpolar moieties to mineral substrates in brine solutions | gold-coated Si3N4 tip | methyl, aromatic, and carboxylic acid groups of alkanethiols | 32 × 32 | 1 × 1 μm2 | (25d) |
| adhesion forces mapped with freshwater diatom, Nitzschia palea in liquid culture medium | gold-coated Si3N4 tip | hydrophobic (dodecanethiol) or hydrophilic coatings (mercaptoundecanol) | 32 × 32 | 2 × 2 μm2 | (25e) |
| antigen–antibody unbinding measured in buffer | amine-functionalized Si3N4 tip | derivatized with antibodies linked to a heterobifunctional PEG800 spacer | 32 × 32 | 4 × 4 μm2 | (23c) |
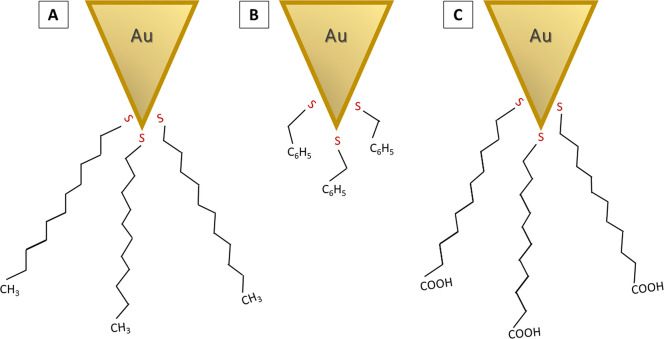
Wettability studies with mica substrates were completed using FVM with thiolated AFM probes, to simulate low salinity and nanofluid enhanced oil recovery (EOR) techniques, as reported by Afekare et al.25d The tip coating strategy with thiolated molecules is illustrated in Figure 12. For FVM studies, a silicon nitride tip that was coated on the underside with a thin layer of gold was used to facilitate Au–S chemisorption of thiolated molecular coatings. Gold-coated probes were functionalized by simple immersion into dilute solutions of thiolated molecules to present methyl, carboxylic acid, and phenyl moieties on the tip surface. The thiol at one end of each molecule is linked to the gold coating via chemisorption, and a hydrocarbon spacer connects designed functionalities (methyl, phenyl, and carboxylic acid) to be presented at the tip interface.
Figure 12.
Concept for functionalizing gold-coated Si3N4 tips with thiolated molecules. Tips were coated with (A) undecanethiol, (B) phenylethanethiol, and (C) mercaptoundecanoic acid.
Using force–volume mapping, adhesion maps (16 × 16 pixels) were obtained with tips terminated with alkyl, aromatic, and carboxylic acid functional groups to probe wettability interactions with mica as a model mineral substrate, as reported by Afekare et al.25d The tip coatings were selected to simulate possible interactions in oil media. An example experimental series is shown in Figure 13, which reveals that as the brine salinity was decreased, the mean adhesion force was reduced. A series of FVM experiments were designed with nanofluids containing SiO2 nanoparticles dispersed in high salinity brine, which revealed that brine and silica nanofluids can be used to alter surface wettability.
Figure 13.
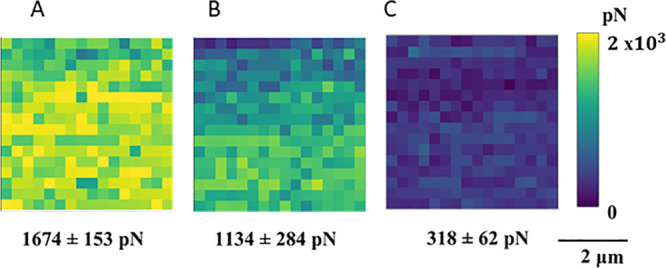
Example force–volume maps (5 × 5 μm2) acquired with a mica substrate, which were collected in brine solutions using a methyl-functionalized tip that was coated with undecanethiol. Adhesion measurements were acquired in (A) high salinity, 72,800 ppm salts; (B) low salinity, 5000 ppm salts; and (C) low salinity brine water, 5000 ppm without cations. Reprinted with permission from ref (25d). Copyright 2020 MDPI.
Diverse chemical and biological interactions have been studied using force–volume mapping with the mode of chemical force microscopy using AFM tips that are coated with biological molecules. For example, a gold-coated tip functionalized with Concanavalin A was employed for mapping the distribution of polysaccharides on living yeast cells (Saccharomyces cerevisiae), by Gad et al.25a Experiments with FVM were conducted for mapping specific receptor–ligand binding interactions for areas spanning 3 × 3 μm2 with a sampling grid of 16 × 16 pixels. Specific molecular recognition was accomplished using a tip coated with Concanavalin A for locally mapping the distribution of mannan, a natural polymer located on the exterior of yeast cells.
The distribution and association of an enzyme was mapped with FVM using biologically coated tips for samples of nerve cells, by Reddy et al.25b The specific interaction between nerve growth factor, a neurotrophin protein, and the tyrosine kinase A enzyme was mapped for the outer membrane of living PC12 nerve cells within a fluid cell containing salt solutions. A gold-coated silicon nitride tip was functionalized using a thiolated cross-linker, succinimidyl 3-(2-pyridyldithio)propionate, which contains a hydroxysuccinimidyl group to react with amino acid groups of the protein. Force maps were generated by scanning the protein-coated AFM tip across a living cell to identify the distribution of the tyrosine kinase A enzyme on the outer surface of cells.
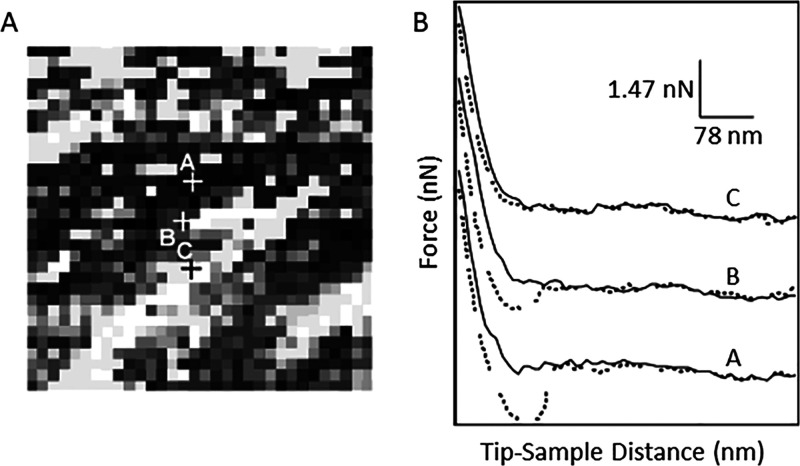
Experiments with FVM were used to map biochemically specific interactions between cholera toxin B oligomer with its receptor, reported by Vengasandra et al.25c A gold-coated AFM probe was functionalized with a receptor ganglioside, GM1, using a cross-linking agent, succinimidyl 3,2-(2-pyridyldithio)propionate (SPDP). For sample preparation, a silicon substrate was coated with gold, and the cholera toxin B oligomer was attached using the SPDP cross-linker which is reactive to the amino acid groups of cholera toxin B. An example FVM image (Figure 14A) depicts an FVM grid map of the relative strength of the interaction between the oligomer and ganglioside receptor, with strong attractive forces being generated at the darkest regions. Weaker attractive forces are apparent at the brighter pixel regions, which have lesser concentrations of cholera toxin B. Force curves from three data points of the force volume image are shown in Figure 14B for pixel regions that have dark, intermediate, and light contrast. Measurements of the attractive forces from multiple approach–retraction cycles acquired with FVM could be specifically correlated to the bond rupture force of the bond between cholera toxin B and ganglioside GM1.
Figure 14.
Grid map of the specific interactions between an oligomer of cholera toxin B with its ganglioside receptor. (A) FVM grid map of adhesion measurements for a 1 × 1 μm2 area of a surface that was modified with cholera toxin B. The probe was coated with receptor ganglioside, GM1. (B) Force curves from three data point positions labeled in A. Experiments were conducted in buffer solutions at pH 7.4. Reprinted with permission from ref (25c). Copyright 2003 American Chemical Society.
Chemical force microscopy studies with FVM were used to characterize samples of the freshwater diatom Nitzschia palea (N. palea), by Lavieale et al.25e The distribution of adhesive molecules for regions of diatom cells was mapped with a coated probe to achieve a lateral resolution of a few nanometers, using a tip that was coated with either hydrophilic or hydrophobic alkanethiols. Diatom cells of N. palea were deposited on gold-coated glass slides that were functionalized with alkanethiols, either mercaptoundecanol or dodecanethiol. Gold-coated silicon nitride tips (nominal spring constant of ∼0.06 N/m) were functionalized with methyl-terminated dodecanethiol to generate a hydrophobic interface, and hydroxyl-terminated mercaptoundecanol furnished a hydrophilic coating. An example FVM experiment that was accomplished in buffer using a hydrophobic tip is shown in Figure 15A, for an area at the central region of a diatom cell. Approximately 20% of the areas that were mapped displayed adhesive events, which could be correlated with molecular density; the adhesion force measurements are plotted in Figure 15B. The rupture lengths ranged up to 4000 nm in length (Figure 15C), and the force signatures revealed approach–retract cycles with both single and multiple peaks that had a sawtooth pattern, which is characteristic of stretching and unfolding of intramolecular domains. The profile of a single peak corresponds to a single extension of the molecules without unfolding events. New insight was gained about the mechanisms of the adhesion of diatoms using FVM experiments combined with chemical force microscopy.
Figure 15.
Adhesion measurements acquired within the central area a diatom cell when using a hydrophobic probe. (A) Force volume map (32 × 32 pixels) of an area at the center of a diatom cell measuring 2 × 2 μm2. (B) Distribution of the adhesion forces in panel A. (C) Histogram of the bond rupture length measured with a hydrophobic tip and example force curves (sample size, n = 1024). Reprinted with permission from ref (25e). Copyright 2019 American Chemical Society.
The strength of unbinding forces was evaluated for specific antigen–antibody interactions using FVM mode with a biofunctionalized AFM probe, as reported by Avci et al.23c Silicon nitride tips were functionalized with amine groups by treatment with ethanolamine–HCl, and then derivatized antibodies were linked to the tip with a spacer consisting of a heterobifunctional PEG800 tether molecule. The linker molecule with the free end conjugated to the antibody was designed with a flexible spacer to increase the chances for the antibody to find and bind to the surface-bound antigen. Force–volume measurements were collected in buffer, in which the 4 × 4 μm2 area was mapped with a 32 × 32 pixel grid, to generate 1024 force–distance curves. Values of the unbinding force of collagen antibody from its antigen were derived using code written with MatLab for automated analysis of force curves. Approximately 20% of the multiple force–distance curves that were acquired showed profiles of adhesive pull-off events, with single or multiple unbinding contact points that are characteristic of the stretching and unfolding of collagen fibrils.
Conclusion
Protocols for studies with FVM mode can be applied to a broad range of nanomaterials and molecular systems to gain fundamental insight of chemical and biochemical properties and surface reactions. Dynamic protocols can be designed by changing the imaging environment, coating the AFM probe for chemical force measurements, or changing the instrument configuration for measuring electrical or physical properties. Key benefits of the FVM mode are the capabilities for correlating force measurements with specific features of AFM topography frames for unraveling the roles of structure and function at small size scales. Considerable progress has been made for speeding the time required for acquisition and post-processing of FVM images, as well as for handling the large electronic data sets that are generated. Future directions will be to continue to apply FVM measurements in novel ways to address research questions and to take full advantage of the capabilities for obtaining multiple channels of information with hybrid SPM measurement modes combined with topography analysis.
Acknowledgments
The authors gratefully acknowledge financial support from the Louisiana Board of Regents Support Fund, Traditional Enhancement Program (LEQSF(2014-16)-ENH-TR-03).
Biographies
Olajumoke H. Olubowale received her B.Tech. in the Science Laboratory Technology (Chemistry option) from Ladoke Akintola University of Technology, Nigeria. She completed a master’s degree in Pure Chemistry at New Mexico Highlands University in 2019. Currently, she is a Ph.D. student in Chemistry at Louisiana State University. Her research is focused on the synthesis and characterization of porphyrinoid nanoparticles using scanning probe microscopy.
Shanta Biswas received B.S. and M.S. degrees from the University of Dhaka, Bangladesh, where she majored in Applied Chemistry and Chemical Engineering. Her broad research interests focus on multidimensional uses of biopolymers applied in designing nanomaterials with improved properties for biomedical and environmental applications, industrial waste management, and nanofiber fabrication. She received a National Science and Technology Fellowship from the Ministry of Science and Technology, Bangladesh for her M.S. studies. Currently, she is a graduate student in the Department of Chemistry at Louisiana State University. Her research focuses on the development of protein–polymer systems to be applied for drug delivery.
Golam Azom received a B.S. degree in Applied Chemistry and Chemical Engineering from the University of Dhaka, Bangladesh in 2020. He is currently a graduate student in Chemistry at Louisiana State University. His research interests mainly focus on understanding the physical chemistry of the liquid interface, including solid–liquid, using molecular simulations.
Benjamin L. Prather received his B.S. in Biochemistry from the University of Delaware in 2018 and earned a master’s degree in chemistry from Louisiana State University in 2021. Benjamin is currently pursuing a Ph.D. in Chemical Biology from Temple University, Philadelphia, PA. He has a background in synthesis and his interests include drug development and probing and directing biochemical interplay through the lens of organic chemistry.
Samuel D. Owoso has an undergraduate degree in Industrial Chemistry from the Federal University of Technology, Akure, Nigeria. He is currently studying Chemistry at Louisiana State University as a graduate student. He is interested in the design, synthesis, and characterization of nanomaterials for energy, medical, and industrial applications.
Khaleda C. Rinee joined the Chemistry department at Louisiana State University for Ph.D. studies in Spring 2021. She earned a B.Sc. degree in Applied Chemistry and Chemical Engineering from University of Dhaka, Bangladesh where she was awarded a National Science and Technology fellowship (NST, Bangladesh). Her research interests focus on the interactions of biomacromolecules and how adjuvants interact with biological membranes.
Karen Marroquin received a B.S. in Chemistry from the University of Houston, TX in 2020. Currently, she is a Ph.D. student in the Department of Chemistry at Louisiana State University. Her research interests are in the design of ligands of phosphorescent organometallic compounds and metal nitride photochemistry.
Kaelin A. Gates earned B.S. and M.S. degrees in Chemistry from Jackson State University, Jackson, MS. He is currently a graduate student in the Department of Chemistry at Louisiana State University. His research interests are in areas of nanomaterial synthesis and design for biomedical applications.
Matthew B. Chambers received a B.A. in Chemistry from Cornell University in 2007 and a Ph.D. in Inorganic Chemistry from the Massachusetts Institute of Technology in 2013 under the supervision of Prof. Dan Nocera. He then spent two years as a postdoctoral researcher in the laboratory of Prof. Marc Fontecave at the Collége de France where he investigated mechanisms of molecular CO2-reduction catalysts. From 2015 to 2017 he was a postdoctoral researcher at University of North Carolina—Chapel Hill in the laboratory of Prof. Alex Miller and studied light initiated hydrogen production from molecular metal hydrides. In 2017, he joined Louisiana State University as an assistant professor in the Chemistry Department. His research interests focus on ligand field considerations for supporting molecular photocatalysis and low pressure carbonylation catalysis.
Amy Xu is an Assistant Professor in Chemistry at the Louisiana State University. She received her B.Sc. and Ph.D. degrees in Chemistry from the University of Auckland, New Zealand. The main goal of her research is to obtain fundamental knowledge of how biomacromolecules interact under crowded environments in order to identify their functions in various applications, including cellular organelles, biopharmaceutical formulations, and surface coatings.
Jayne C. Garno earned a B.S. degree in Biology from the University of Michigan, Ann Arbor and also has a B.S. degree in Chemistry from Saginaw Valley State University in Saginaw, MI. She received a Ph.D. degree in Chemistry from Wayne State University, Detroit, MI. She completed postdoctoral studies at National Institute of Standards and Technology, Gaithersburg, MD. Currently, she is a Professor of Chemistry at Louisiana State University with research interests in scanning probe instrumentation, analytical chemistry, surface science, and nanoscience.
The authors declare no competing financial interest.
References
- Radmacher M.; Cleveland J. P.; Fritz M.; Hansma H. G.; Hansma P. K. Mapping interaction forces with the atomic force microscope. Biophys. J. 1994, 66 (6), 2159–2165. 10.1016/S0006-3495(94)81011-2. [DOI] [PMC free article] [PubMed] [Google Scholar]
- a Cappella B.; Dietler G. Force-distance curves by atomic force microscopy. Surf. Sci. Rep. 1999, 34 (1–3), 1–104. 10.1016/S0167-5729(99)00003-5. [DOI] [Google Scholar]; b Butt H.-J.; Cappella B.; Kappl M. Force measurements with the atomic force microscope: Technique, interpretation and applications. Surf. Sci. Rep. 2005, 59 (1–6), 1–152. 10.1016/j.surfrep.2005.08.003. [DOI] [Google Scholar]
- a Alessandrini A.; Facci P. AFM: a versatile tool in biophysics. Meas. Sci. Technol. 2005, 16 (6), R65–R92. 10.1088/0957-0233/16/6/R01. [DOI] [Google Scholar]; b Heinz W. F.; Hoh J. H. Spatially resolved force spectroscopy of biological surfaces using the atomic force microscope. Trends Biotechnol. 1999, 17 (4), 143–150. 10.1016/S0167-7799(99)01304-9. [DOI] [PubMed] [Google Scholar]
- a A-Hassan E.; Heinz W. F.; Antonik M. D.; D’Costa N. P.; Nageswaran S.; Schoenenberger C.-A.; Hoh J. H. Relative Microelastic Mapping of Living Cells by Atomic Force Microscopy. Biophys. J. 1998, 74 (3), 1564–1578. 10.1016/S0006-3495(98)77868-3. [DOI] [PMC free article] [PubMed] [Google Scholar]; b Wu F.; Bhupathiraju N. V. S. D. K.; Brown A.; Liu Z.; Drain C. M.; Batteas J. D. Mechanical and Electronic Properties of Diacetylene and Polydiacetylene Self-Assembled Monolayers on Au(111). J. Phys. Chem. C 2020, 124 (7), 4081–4089. 10.1021/acs.jpcc.9b09600. [DOI] [Google Scholar]; c Schaer-Zammaretti P.; Ubbink J. Imaging of lactic acid bacteria with AFM - elasticity and adhesion maps and their relationship to biological and structural data. Ultramicroscopy 2003, 97 (1–4), 199–208. 10.1016/S0304-3991(03)00044-5. [DOI] [PubMed] [Google Scholar]; d Walczyk W.; Hain N.; Schonherr H. Hydrodynamic effects of the tip movement on surface nanobubbles: a combined tapping mode, lift mode and force volume mode AFM study. Soft Matter 2014, 10 (32), 5945–5954. 10.1039/C4SM01024H. [DOI] [PubMed] [Google Scholar]; e Marshall H.; Aguayo S.; Kilian M.; Petersen F.; Bozec L.; Brown J. Vivo Relationship between the Nano-Biomechanical Properties of Streptococcal Polysaccharide Capsules and Virulence Phenotype. ACS Nano 2020, 14 (1), 1070–1083. 10.1021/acsnano.9b08631. [DOI] [PubMed] [Google Scholar]; f Stühn L.; Fritschen A.; Choy J.; Dehnert M.; Dietz C. Nanomechanical sub-surface mapping of living biological cells by force microscopy. Nanoscale 2019, 11 (27), 13089–13097. 10.1039/C9NR03497H. [DOI] [PubMed] [Google Scholar]; g Kim D. T.; Blanch H. W.; Radke C. J. Direct Imaging of Lysozyme Adsorption onto Mica by Atomic Force Microscopy. Langmuir 2002, 18 (15), 5841–5850. 10.1021/la0256331. [DOI] [Google Scholar]; h Rein C.; Pszon-Bartosz K.; Stibius K. B.; Bjørnholm T.; Hélix-Nielsen C. Free-Standing Biomimetic Polymer Membrane Imaged with Atomic Force Microscopy. Langmuir 2011, 27 (2), 499–503. 10.1021/la103632q. [DOI] [PubMed] [Google Scholar]; i Tripathi M.; King A.; Fratta G.; Meloni M.; Large M.; Salvage J. P.; Pugno N. M.; Dalton A. B. Laser-Based Texturing of Graphene to Locally Tune Electrical Potential and Surface Chemistry. ACS Omega 2018, 3 (12), 17000–17009. 10.1021/acsomega.8b02815. [DOI] [PMC free article] [PubMed] [Google Scholar]
- a Polyakov P.; Soussen C.; Duan J.; Duval J. F.; Brie D.; Francius G. Automated force volume image processing for biological samples. PLoS One 2011, 6 (4), e18887 10.1371/journal.pone.0018887. [DOI] [PMC free article] [PubMed] [Google Scholar]; b Chang Y. R.; Raghunathan V. K.; Garland S. P.; Morgan J. T.; Russell P.; Murphy C. J. Automated AFM force curve analysis for determining elastic modulus of biomaterials and biological samples. J. Mech. Behav. Biomed. Mater. 2014, 37, 209–18. 10.1016/j.jmbbm.2014.05.027. [DOI] [PMC free article] [PubMed] [Google Scholar]
- a Nečas D.; Klapetek P. Gwyddion: An Open-Source Software for SPM Data Analysis. Cent. Eur. J. Phys. 2012, 10 (1), 181–188. 10.2478/s11534-011-0096-2. [DOI] [Google Scholar]; b Profilm Online; Filmetrics: San Diego, CA, 2021;.; c Jørgensen J. F.Scanning Probe Image Processor (SPIP); Image Metrology: Lyngby, Denmark, 1988. [Google Scholar]; d Chopinet L.; Formosa C.; Rols M. P.; Duval R. E.; Dague E. Imaging living cells surface and quantifying its properties at high resolution using AFM in QI mode. Micron 2013, 48, 26–33. 10.1016/j.micron.2013.02.003. [DOI] [PubMed] [Google Scholar]; e Dinarelli S.; Girasole M.; Longo G. FC_analysis: A tool for investigating atomic force microscopy maps of force curves. BMC Bioinf. 2018, 19 (1), 258. 10.1186/s12859-018-2265-4. [DOI] [PMC free article] [PubMed] [Google Scholar]; f Zahl P.; Bierkandt M.; Schröder S.; Klust A. The flexible and modern open source scanning probe microscopy software package GXSM. Rev. Sci. Instrum. 2003, 74 (3), 1222–1227. 10.1063/1.1540718. [DOI] [Google Scholar]; g Zahl P.; Wagner T.; Möller R.; Klust A. Open source scanning probe microscopy control software package GXSM. J. Vac. Sci. Technol., B: Nanotechnol. Microelectron.: Mater., Process., Meas., Phenom. 2010, 28 (3), C4E39–C4E47. 10.1116/1.3374719. [DOI] [Google Scholar]; h Pittenger B.; Erina N.; Chanmin S.. PeakForce QNM. Bruker Application Note; Bruker: Billerica, MA, USA: 2009; p 128.; i Young T. J.; Monclus M. A.; Burnett T. L.; Broughton W. R.; Ogin S. L.; Smith P. A. The use of the PeakForceTM quantitative nanomechanical mapping AFM-based method for high-resolution Young’s modulus measurement of polymers. Meas. Sci. Technol. 2011, 22 (12), 125703. 10.1088/0957-0233/22/12/125703. [DOI] [Google Scholar]; j Xu K.; Sun W.; Shao Y.; Wei F.; Zhang X.; Wang W.; Li P. Recent development of PeakForce Tapping mode atomic force microscopy and its applications on nanoscience. Nanotechnol. Rev. 2018, 7 (6), 605–621. 10.1515/ntrev-2018-0086. [DOI] [Google Scholar]; k Pittenger B.; Erina N.; Su C.. Mechanical Property Mapping at the Nanoscale Using PeakForce QNM Scanning Probe Technique. In Nanomechanical Analysis of High Performance Materials. Solid Mechanics and Its Applications; Tiwari A., Ed.; Springer: Dordrecht, The Netherlands, 2014; Vol. 203, pp 31–51. [Google Scholar]; l Wood D.; Hancox I.; Jones T. S.; Wilson N. R. Quantitative Nanoscale Mapping with Temperature Dependence of the Mechanical and Electrical Properties of Poly(3-hexylthiophene) by Conductive Atomic Force Microscopy. J. Phys. Chem. C 2015, 119 (21), 11459–11467. 10.1021/acs.jpcc.5b02197. [DOI] [Google Scholar]; m Kim S.; Lee Y.; Lee M.; An S.; Cho S. J. Quantitative Visualization of the Nanomechanical Young’s Modulus of Soft Materials by Atomic Force Microscopy. Nanomaterials 2021, 11 (6), 1593. 10.3390/nano11061593. [DOI] [PMC free article] [PubMed] [Google Scholar]; n Stoica I.; Epure E. L.; Constantin C. P.; Damaceanu M. D.; Ursu E. L.; Mihaila I.; Sava I. Evaluation of Local Mechanical and Chemical Properties via AFM as a Tool for Understanding the Formation Mechanism of Pulsed UV Laser-Nanoinduced Patterns on Azo-Naphthalene-Based Polyimide Films. Nanomaterials 2021, 11 (3), 812. 10.3390/nano11030812. [DOI] [PMC free article] [PubMed] [Google Scholar]; o Hurley D.; Marta Kocun M.; Revenko I.; Ohler B.; Proksch R. Fast, quantitative AFM nanomechanical measurements using AM-FM Viscoelastic Mapping Mode. Microsc. Anal. 2015, 29, 9–13. [Google Scholar]; p Application Note: The NanomechPro Toolkit: Nanomechanical AFM Techniques for Diverse Materials, Data sheet 43 , April 2015; Oxford Instruments, Asylum Research: Santa Barbara, CA, USA, 2015.; q Garcia R.; Proksch R. Nanomechanical mapping of soft matter by bimodal force microscopy. Eur. Polym. J. 2013, 49 (8), 1897–1906. 10.1016/j.eurpolymj.2013.03.037. [DOI] [Google Scholar]; r Magonov S.; Belikov S.; Alexander J. D.; Wall S.; Leesment S.; Bykov V.. Scanning Probe Based Apparatus and Methods for Low-Force Profiling of Sample Surfaces and Detection and Mapping of Local Mechanical and Electromagnetic Properties in Non-Resonant Oscillatory Mode US9110092B1, 2015.; s Krotil H.-U.; Stifter T.; Waschipky H.; Weishaupt K.; Hild S.; Marti O. Pulsed Force Mode: a New Method for the Investigation of Surface Properties. Surf. Interface Anal. 1999, 27, 336–340. . [DOI] [Google Scholar]
- Smolyakov G.; Formosa-Dague C.; Severac C.; Duval R. E.; Dague E. High speed indentation measures by FV, QI and QNM introduce a new understanding of bionanomechanical experiments. Micron 2016, 85, 8–14. 10.1016/j.micron.2016.03.002. [DOI] [PubMed] [Google Scholar]
- a Tian M.; Li Y.; Liu W.; Jin L.; Jiang X.; Wang X.; Ding Z.; Peng Y.; Zhou J.; Fan J.; Cao Y.; Wang W.; Shi Y. The nanomechanical signature of liver cancer tissues and its molecular origin. Nanoscale 2015, 7 (30), 12998–13010. 10.1039/C5NR02192H. [DOI] [PubMed] [Google Scholar]; b Cui Y.; Zhang X.; You K.; Guo Y.; Liu C.; Fang X.; Geng L. Nanomechanical Characteristics of Cervical Cancer and Cervical Intraepithelial Neoplasia Revealed by Atomic Force Microscopy. Med. Sci. Monit. 2017, 23, 4205–4213. 10.12659/MSM.903484. [DOI] [PMC free article] [PubMed] [Google Scholar]; c Plodinec M.; Loparic M.; Monnier C. A.; Obermann E. C.; Zanetti-Dallenbach R.; Oertle P.; Hyotyla J. T.; Aebi U.; Bentires-Alj M.; Lim R. Y.; Schoenenberger C. A. The nanomechanical signature of breast cancer. Nat. Nanotechnol. 2012, 7 (11), 757–65. 10.1038/nnano.2012.167. [DOI] [PubMed] [Google Scholar]; d Ciasca G.; Sassun T. E.; Minelli E.; Antonelli M.; Papi M.; Santoro A.; Giangaspero F.; Delfini R.; De Spirito M. Nano-mechanical signature of brain tumours. Nanoscale 2016, 8 (47), 19629–19643. 10.1039/C6NR06840E. [DOI] [PubMed] [Google Scholar]
- Darling E. M.; Wilusz R. E.; Bolognesi M. P.; Zauscher S.; Guilak F. Spatial mapping of the biomechanical properties of the pericellular matrix of articular cartilage measured in situ via atomic force microscopy. Biophys. J. 2010, 98 (12), 2848–56. 10.1016/j.bpj.2010.03.037. [DOI] [PMC free article] [PubMed] [Google Scholar]
- Longo G.; Rio L. M.; Roduit C.; Trampuz A.; Bizzini A.; Dietler G.; Kasas S. Force volume and stiffness tomography investigation on the dynamics of stiff material under bacterial membranes. J. Mol. Recognit. 2012, 25 (5), 278–284. 10.1002/jmr.2171. [DOI] [PubMed] [Google Scholar]
- Zhou X.; Cui C.; Zhang J.; Liu J.; Liu J. Nanomechanics of individual amyloid fibrils using atomic force microscopy. Chin. Sci. Bull. 2010, 55 (16), 1608–1612. 10.1007/s11434-010-3201-9. [DOI] [Google Scholar]
- a Sunnerberg J. P.; Moore P.; Spedden E.; Kaplan D. L.; Staii C. Variations of elastic modulus and cell volume with temperature for cortical neurons. Langmuir 2019, 35 (33), 10965–10976. 10.1021/acs.langmuir.9b01651. [DOI] [PMC free article] [PubMed] [Google Scholar]; b Efremov Y. M.; Grebenik E. A.; Sharipov R. R.; Krasilnikova I. A.; Kotova S. L.; Akovantseva A. A.; Bakaeva Z. V.; Pinelis V. G.; Surin A. M.; Timashev P. S. Viscoelasticity and Volume of Cortical Neurons under Glutamate Excitotoxicity and Osmotic Challenges. Biophys. J. 2020, 119 (9), 1712–1723. 10.1016/j.bpj.2020.09.022. [DOI] [PMC free article] [PubMed] [Google Scholar]; c Reynaud C.; Sommer F.; Quet C.; El Bounia N.; Duc T. M. Quantitative determination of Young’s modulus on a biphase polymer system using atomic force microscopy. Surf. Interface Anal. 2000, 30 (1), 185–189. . [DOI] [Google Scholar]; d Krämer G.; Griepentrog M.; Bonaccurso E.; Cappella B. Study of morphology and mechanical properties of polystyrene–polybutadiene blends with nanometre resolution using AFM and force–distance curves. Eur. Polym. J. 2014, 55, 123–134. 10.1016/j.eurpolymj.2014.03.026. [DOI] [Google Scholar]; e Voss A.; Stark R. W.; Dietz C. Surface versus Volume Properties on the Nanoscale: Elastomeric Polypropylene. Macromolecules 2014, 47 (15), 5236–5245. 10.1021/ma500578e. [DOI] [Google Scholar]; f Gaboriaud F.; Parcha B. S.; Gee M. L.; Holden J. A.; Strugnell R. A. Spatially resolved force spectroscopy of bacterial surfaces using force-volume imaging. Colloids Surf., B 2008, 62 (2), 206–213. 10.1016/j.colsurfb.2007.10.004. [DOI] [PubMed] [Google Scholar]
- a Bahrami A.; Bailly C.; Nysten B. Spatial resolution and property contrast in local mechanical mapping of polymer blends using AFM dynamic force spectroscopy. Polymer 2019, 165, 180–190. 10.1016/j.polymer.2019.01.023. [DOI] [Google Scholar]; b Derjaguin B. V.; Muller V. M.; Toporov Y. P. Effect of contact deformations on the adhesion of particles. J. Colloid Interface Sci. 1975, 53 (2), 314–326. 10.1016/0021-9797(75)90018-1. [DOI] [Google Scholar]; c Dimitriadis E. K.; Horkay F.; Maresca J.; Kachar B.; Chadwick R. S. Determination of Elastic Moduli of Thin Layers of Soft Material Using the Atomic Force Microscope. Biophys. J. 2002, 82 (5), 2798–2810. 10.1016/S0006-3495(02)75620-8. [DOI] [PMC free article] [PubMed] [Google Scholar]; d Lin D. C.; Dimitriadis E. K.; Horkay F. Robust strategies for automated AFM force curve analysis--I. Non-adhesive indentation of soft, inhomogeneous materials. J. Biomech. Eng. 2007, 129 (3), 430–40. 10.1115/1.2720924. [DOI] [PubMed] [Google Scholar]
- van der Werf K. O.; Putman C. A. J.; de Grooth B. G.; Greve J. Adhesion force imaging in air and liquid by adhesion mode atomic force microscopy. Appl. Phys. Lett. 1994, 65 (9), 1195–1197. 10.1063/1.112106. [DOI] [Google Scholar]
- a Banerjee S. S.; Kumar K. D.; Sikder A. K.; Bhowmick A. K. Nanomechanics and Origin of Rubber Elasticity of Novel Nanostructured Thermoplastic Elastomeric Blends Using Atomic Force Microscopy. Macromol. Chem. Phys. 2015, 216, 1666–1674. 10.1002/macp.201500173. [DOI] [Google Scholar]; b Banerjee S. S.; Janke A.; Gohs U.; Heinrich G. Electron-induced reactive processing of polyamide 6/polypropylene blends: Morphology and properties. Eur. Polym. J. 2018, 98, 295–301. 10.1016/j.eurpolymj.2017.11.030. [DOI] [Google Scholar]; c Criado M.; Rebollar E.; Nogales A.; Ezquerra T. A.; Boulmedais F.; Mijangos C.; Hernandez R. Quantitative Nanomechanical Properties of Multilayer Films Made of Polysaccharides through Spray Assisted Layer-by-Layer Assembly. Biomacromolecules 2017, 18 (1), 169–177. 10.1021/acs.biomac.6b01449. [DOI] [PubMed] [Google Scholar]; d Banerjee S. S.; Janke A.; Jehnichen D.; Gohs U.; Heinrich G. Influence of electron-induced reactive processing on structure, morphology and nano-mechanical properties of polyamide 6/fluoroelastomer blends. Polymer 2018, 142, 394–402. 10.1016/j.polymer.2018.03.042. [DOI] [Google Scholar]; e Chlanda A.; Rebis J.; Kijenska E.; Wozniak M. J.; Rozniatowski K.; Swieszkowski W.; Kurzydlowski K. J. Quantitative imaging of electrospun fibers by PeakForce Quantitative NanoMechanics atomic force microscopy using etched scanning probes. Micron 2015, 72, 1–7. 10.1016/j.micron.2015.01.005. [DOI] [PubMed] [Google Scholar]; f Niu Y.-F.; Yang Y.; Gao S.; Yao J.-W. Mechanical mapping of the interphase in carbon fiber reinforced poly(ether-ether-ketone) composites using peak force atomic force microscopy: Interphase shrinkage under coupled ultraviolet and hydro-thermal exposure. Polym. Test. 2016, 55, 257–260. 10.1016/j.polymertesting.2016.09.008. [DOI] [Google Scholar]; g Reggente M.; Natali M.; Passeri D.; Lucci M.; Davoli I.; Pourroy G.; Masson P.; Palkowski H.; Hangen U.; Carradò A.; Rossi M. Multiscale mechanical characterization of hybrid Ti/PMMA layered materials. Colloids Surf., A 2017, 532, 244–251. 10.1016/j.colsurfa.2017.05.011. [DOI] [Google Scholar]; h Lorenzoni M.; Evangelio L.; Nicolet C.; Navarro C.; San Paulo A.; Rius G.; Pérez-Murano F. Nanomechanical properties of solvent cast polystyrene and poly(methyl methacrylate) polymer blends and self-assembled block copolymers. J. Micro/Nanolithogr., MEMS, MOEMS 2015, 14 (3), 033509. 10.1117/1.JMM.14.3.033509. [DOI] [Google Scholar]; i Panaitescu D. M.; Frone A. N.; Nicolae C. Micro- and nano-mechanical characterization of polyamide 11 and its composites containing cellulose nanofibers. Eur. Polym. J. 2013, 49 (12), 3857–3866. 10.1016/j.eurpolymj.2013.09.031. [DOI] [Google Scholar]
- Germanicus R. C.; Mercier D.; Agrebi F.; Febvre M.; Mariolle D.; Descamps P.; Leclere P. Quantitative mapping of high modulus materials at the nanoscale: Comparative study between atomic force microscopy and nanoindentation. J. Microsc. 2020, 280 (1), 51–62. 10.1111/jmi.12935. [DOI] [PubMed] [Google Scholar]
- a Zhang H. Y.; Chen X. G.; Tang Y. Y.; Liao W. Q.; Di F. F.; Mu X.; Peng H.; Xiong R. G. PFM (piezoresponse force microscopy)-aided design for molecular ferroelectrics. Chem. Soc. Rev. 2021, 50, 8248–8278. 10.1039/C9CS00504H. [DOI] [PubMed] [Google Scholar]; b Yang S. M.; Kim Y. Nanoscale Probing of Ferroelectric Domain Switching Using Piezoresponse Force Microscopy. Han'guk Seramik Hakhoechi 2019, 56 (4), 340–349. 10.4191/kcers.2019.56.4.05. [DOI] [Google Scholar]; c Kalinin S. V.; Rodriguez B. J.; Jesse S.; Karapetian E.; Mirman B.; Eliseev E. A.; Morozovska A. N. Nanoscale Electromechanics of Ferroelectric and Biological Systems: A New Dimension in Scanning Probe Microscopy. Annu. Rev. Mater. Res. 2007, 37 (1), 189–238. 10.1146/annurev.matsci.37.052506.084323. [DOI] [Google Scholar]
- Ursic H.; Prah U. Investigations of ferroelectric polycrystalline bulks and thick films using piezoresponse force microscopy. Proc. R. Soc. London, Ser. A 2019, 475 (2223), 20180782. 10.1098/rspa.2018.0782. [DOI] [PMC free article] [PubMed] [Google Scholar]
- Kwon O.; Seol D.; Qiao H.; Kim Y. Recent Progress in the Nanoscale Evaluation of Piezoelectric and Ferroelectric Properties via Scanning Probe Microscopy. Adv. Sci. (Weinh) 2020, 7 (17), 1901391. 10.1002/advs.201901391. [DOI] [PMC free article] [PubMed] [Google Scholar]
- a Sun Y.; Zeng K.; Li T. Piezo-/ferroelectric phenomena in biomaterials: A brief review of recent progress and perspectives. Sci. China: Phys., Mech. Astron. 2020, 63 (7), 278701. 10.1007/s11433-019-1500-y. [DOI] [Google Scholar]; b Cheong L. Z.; Zhao W.; Song S.; Shen C. Lab on a tip: Applications of functional atomic force microscopy for the study of electrical properties in biology. Acta Biomater. 2019, 99, 33–52. 10.1016/j.actbio.2019.08.023. [DOI] [PubMed] [Google Scholar]; c Heo Y.; Sharma P.; Liu Y. Y.; Li J. Y.; Seidel J. Mechanical probing of ferroelectrics at the nanoscale. J. Mater. Chem. C 2019, 7 (40), 12441–12462. 10.1039/C9TC02661D. [DOI] [Google Scholar]; d Denning D.; Guyonnet J.; Rodriguez B. J. Applications of piezoresponse force microscopy in materials research: from inorganic ferroelectrics to biopiezoelectrics and beyond. Int. Mater. Rev. 2016, 61 (1), 46–70. 10.1179/1743280415Y.0000000013. [DOI] [Google Scholar]; e Kalinin S. V.; Rar A.; Jesse S. A decade of piezoresponse force microscopy: progress, challenges, and opportunities. IEEE Trans. Ultrason. Ferroelectr. Freq. Control 2006, 53 (12), 2226–52. 10.1109/TUFFC.2006.169. [DOI] [PubMed] [Google Scholar]; f Foschini C. R.; Ramirez M. A.; Simões S. R.; Varela J. A.; Longo E.; Simões A. Z. Piezoresponse force microscopy characterization of rare-earth doped BiFeO3 thin films grown by the soft chemical method. Ceram. Int. 2013, 39 (3), 2185–2195. 10.1016/j.ceramint.2012.08.083. [DOI] [Google Scholar]; g Balke N.; Bdikin I.; Kalinin S. V.; Kholkin A. L. Electromechanical Imaging and Spectroscopy of Ferroelectric and Piezoelectric Materials: State of the Art and Prospects for the Future. J. Am. Ceram. Soc. 2009, 92 (8), 1629–1647. 10.1111/j.1551-2916.2009.03240.x. [DOI] [Google Scholar]
- Checa M.; Millan-Solsona R.; Blanco N.; Torrents E.; Fabregas R.; Gomila G. Mapping the dielectric constant of a single bacterial cell at the nanoscale with scanning dielectric force volume microscopy. Nanoscale 2019, 11 (43), 20809–20819. 10.1039/C9NR07659J. [DOI] [PubMed] [Google Scholar]
- Kyndiah A.; Checa M.; Leonardi F.; Millan-Solsona R.; Di Muzio M.; Tanwar S.; Fumagalli L.; Mas-Torrent M.; Gomila G. Nanoscale Mapping of the Conductivity and Interfacial Capacitance of an Electrolyte-Gated Organic Field-Effect Transistor under Operation. Adv. Funct. Mater. 2021, 31 (5), 2008032. 10.1002/adfm.202008032. [DOI] [Google Scholar]
- a Almqvist N.; Bhatia R.; Primbs G.; Desai N.; Banerjee S.; Lal R. Elasticity and Adhesion Force Mapping Reveals Real-Time Clustering of Growth Factor Receptors and Associated Changes in Local Cellular Rheological Properties. Biophys. J. 2004, 86 (3), 1753–1762. 10.1016/S0006-3495(04)74243-5. [DOI] [PMC free article] [PubMed] [Google Scholar]; b Creasey R.; Sharma S.; Gibson C. T.; Craig J. E.; Ebner A.; Becker T.; Hinterdorfer P.; Voelcker N. H. Atomic force microscopy-based antibody recognition imaging of proteins in the pathological deposits in pseudoexfoliation syndrome. Ultramicroscopy 2011, 111 (8), 1055–61. 10.1016/j.ultramic.2011.03.008. [DOI] [PubMed] [Google Scholar]; c Avci R.; Schweitzer M.; Boyd R. D.; Wittmeyer J.; Steele A.; Toporski J.; Beech I.; Arce F. T.; Spangler B.; Cole K. M.; McKay D. S. Comparison of antibody–antigen interactions on collagen measured by conventional immunological techniques and atomic force microscopy. Langmuir 2004, 20 (25), 11053–11063. 10.1021/la036376i. [DOI] [PubMed] [Google Scholar]; d Medalsy I.; Hensen U.; Muller D. J. Imaging and quantifying chemical and physical properties of native proteins at molecular resolution by force–volume AFM. Angew. Chem., Int. Ed. 2011, 50 (50), 12103–12108. 10.1002/anie.201103991. [DOI] [PubMed] [Google Scholar]
- Calò A.; Romin Y.; Srouji R.; Zambirinis C. P.; Fan N.; Santella A.; Feng E.; Fujisawa S.; Turkekul M.; Huang S.; et al. Spatial mapping of the collagen distribution in human and mouse tissues by force volume atomic force microscopy. Sci. Rep. 2020, 10 (1), 15664. 10.1038/s41598-020-72564-9. [DOI] [PMC free article] [PubMed] [Google Scholar]
- a Gad M.; Itoh A.; Ikai A. Mapping cell wall polysaccharides of living microbial cells using atomic force microscopy. Cell Biol. Int. 1997, 21 (11), 697–706. 10.1006/cbir.1997.0214. [DOI] [PubMed] [Google Scholar]; b Reddy C. V.; Malinowska K.; Menhart N.; Wang R. Identification of TrkA on living PC12 cells by atomic force microscopy. Biochim. Biophys. Acta, Biomembr. 2004, 1667 (1), 15–25. 10.1016/j.bbamem.2004.08.011. [DOI] [PubMed] [Google Scholar]; c Vengasandra S.; Sethumadhavan G.; Yan F.; Wang R. Studies on the Protein–Receptor Interaction by Atomic Force Microscopy. Langmuir 2003, 19 (26), 10940–10946. 10.1021/la035391k. [DOI] [Google Scholar]; d Afekare D.; Garno J. C.; Rao D. Insights into Nanoscale Wettability Effects of Low Salinity and Nanofluid Enhanced Oil Recovery Techniques. Energies 2020, 13 (17), 4443. 10.3390/en13174443. [DOI] [Google Scholar]; e Laviale M.; Beaussart A.; Allen J.; Quilès F.; El-Kirat-Chatel S. Probing the Adhesion of the Common Freshwater Diatom Nitzschia palea at Nanoscale. ACS Appl. Mater. Interfaces 2019, 11 (51), 48574–48582. 10.1021/acsami.9b17821. [DOI] [PubMed] [Google Scholar]


