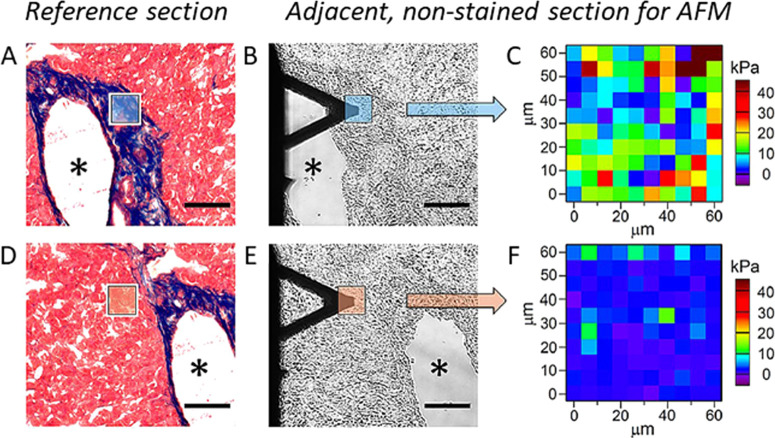
Figure 10.
Maps of elastic modulus values compared for areas of collagen-enriched and low collagen areas in frozen-fixed mouse tissue, pinpointed with optical and AFM images. (A) Optical microscopy image of a stained tissue section with low collagen areas indicated in red, and collagen-enriched areas (framed area) stained in blue. The asterisk shows a hollow cavity from a large blood vessel wall as a reference feature. (B) Adjacent, nonstained area of the same tissue sample imaged with bright-field microscopy showing the area scanned with an AFM probe for FVM measurements. (C) Elastic modulus map of the collagen-enriched area framed in panel B. (D) Microscopy image of stained tissue section with low collagen density. (E) Placement of the cantilever tip shown for an unstained section with a bright-field image. (F) Elastic modulus maps of the area with low collagen content shown in panel E. (Scale bar, 100 μm; map size, 60 × 60 μm2; pixel size, 6 × 6 μm2). Reprinted with permission from ref (24). Copyright 2020 Springer Nature.

