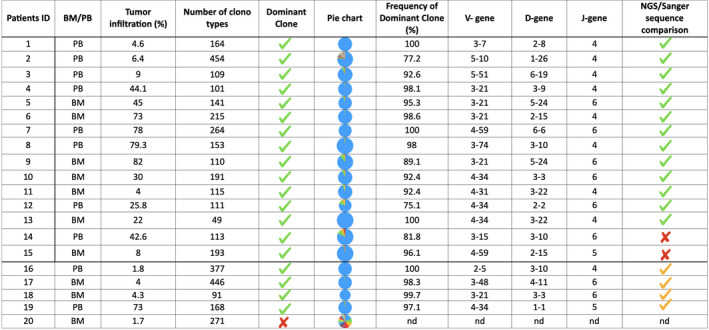
Table II.
Comparison between next‐generation sequencing (NGS) and the classic polymerase chain reaction (PCR) marker screening approaches. For each patient d the type of sample on which the marker screening was implemented, the tumour infiltration value, the number of clonotypes selected by HashClone, the presence of the dominant clone, a pie chart showing the frequency values of the clones selected, the frequency of the dominant clone, the V, D and J gene of the major clone and the agreement between NGS and the Sanger technique are reported. Yellow check‐marks are used to mention the identification of the dominant clone in the NGS but not in the Sanger experiment. [Colour table can be viewed at wileyonlinelibrary.com]