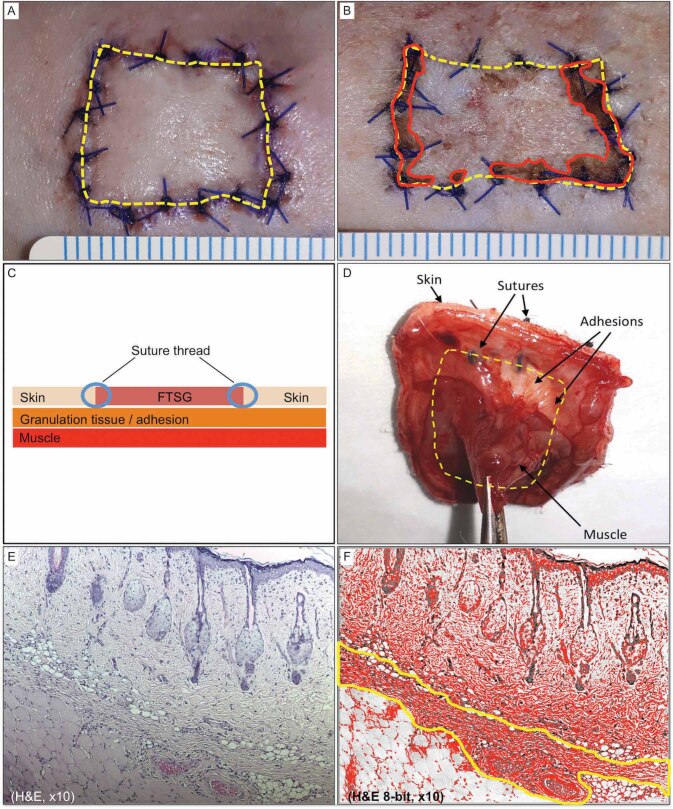
Fig. 2 (A-F). Tissue analysis technique.
Manual tracing for quantifying the full-thickness skin graft (FTSG) surface area and nonviable region ( A, B ). Schematic illustration of the cross-sectional view ( C ) and clinical photograph of posteroanterior view of the explanted graft (D). Cross-section of H&E stain explant showing the three distinct tissue layers ( E ) and after threshold analysis of the same image selecting the collagen layers sandwiched between the skin graft and muscle tissue ( F ).

