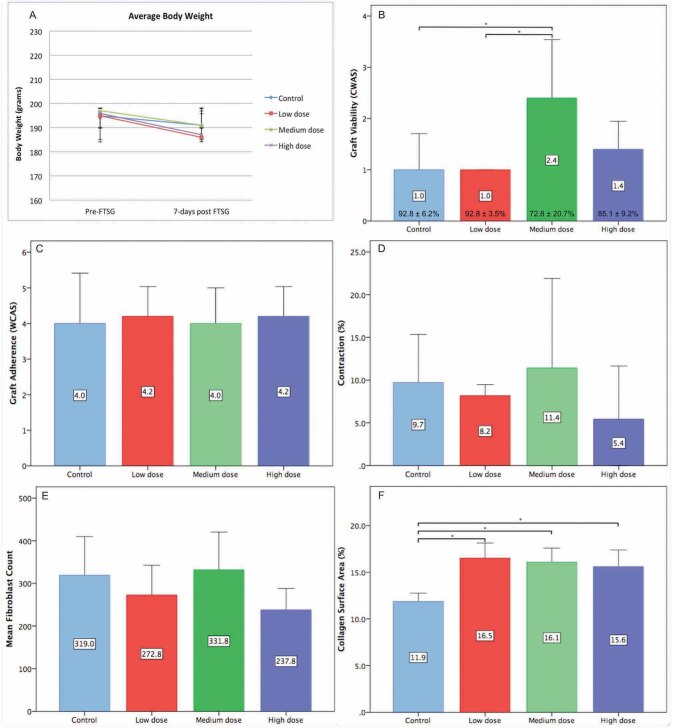
Fig. 3 (.
A-F ). Results. Data were expressed as mean ± standard deviation (SD) unless stated otherwise, n = 10 rats/group, * p < 0.05. The average subjects’ body weight pre- and post- full-thickness skin graft (FTSG) ( A ). Graft viability graded with clinical wound assessment scale (CWAS), percentage of graft viability presented at the bottom of the bars ( B ). Graft adherence graded with CWAS ( C ). Graft contraction presented in percentage of surface area reduction ( D ). Fibroblast count presented in cells/five HPF ( E ). Collagen surface area presented as percentage of surface area ( F ).

