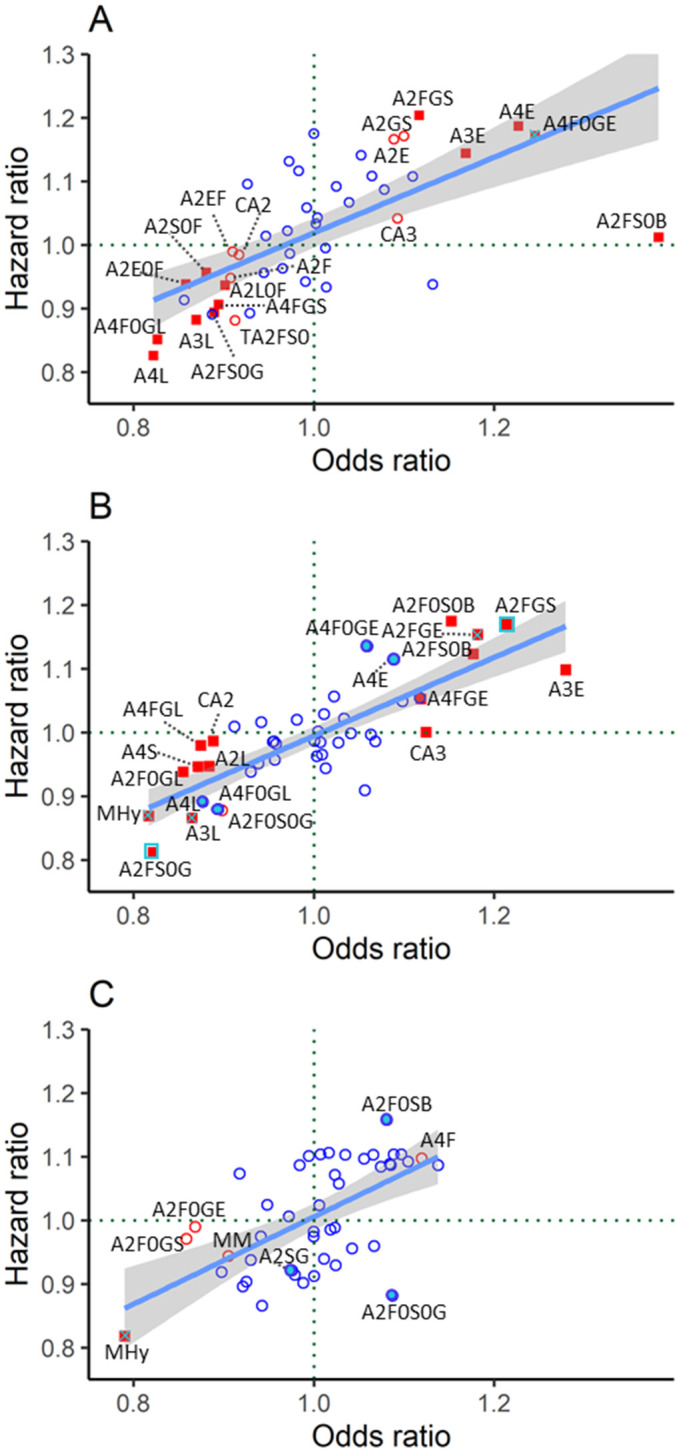
Figure 1.

N-glycan-derived trait HR plotted versus OR for meta-analyzed data from DiaGene and Hoorn Diabetes Care System studies in the basic model (adjusted for age, sex, and age×sex interaction). (A) Cardiovascular disease, (B) nephropathy, and (C) retinopathy. Red-filled blue square: significant in prevalent and incident complications after FDR correction. Red-filled square with blue cross: significant in prevalent complications after FDR correction and in incident complications before FDR correction. Red-filled square: significant in prevalent complications after FDR correction. Blue-filled circle: significant in incident complications before FDR correction. Red unfilled circle: significant in prevalent complications before FDR correction. Blue unfilled circle: non-significant. Glycan derived trait abbreviations are described in table 2 and online supplemental table 3. FDR, false discovery rate.
