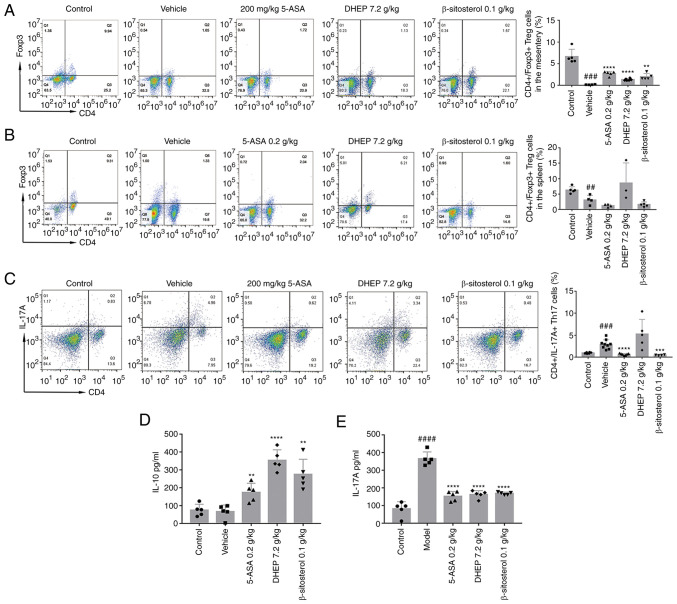
Figure 4.
DHEP and β-sitosterol treatments promote T cell differentiation in mice. Representative flow cytometric profiles and quantitative analysis of the (A) spleen and (B) mesenteric lymph nodes Treg cells, and (C) spleen Th17 cells (n= 3-9). ELISA showing (D) IL-10 and (E) IL-17A protein expression levels (NN=5). ##P<0.01, ###P<0.005 and ####P<0.001 vs. control group; **P<0.01, ***P<0.005 and ****P<0.001 vs. vehicle group. DHEP, Ding's herbal enema; 5-ASA, mesalazine; Th, T helper cell; Treg, regulatory T cell.

