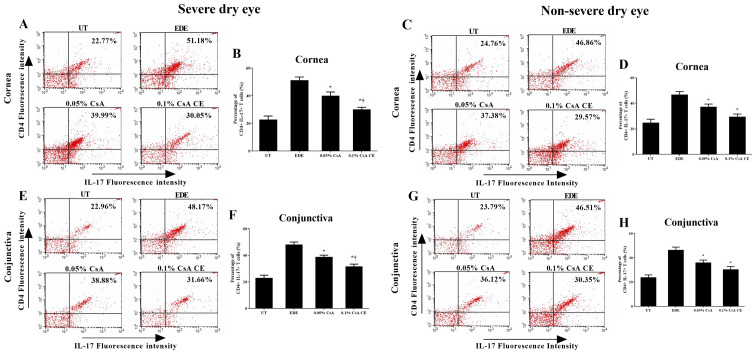
Figure 6.
Flow cytometric analysis for CD4+ T cells. Percentage of CD4+ IL-17+ T cells in the (A-D) cornea and (E-H) conjunctiva in UT, EDE, 0.05% CsA emulsion-treated and 0.1% CsA CE-treated mice from the severe dry eye and non-severe dry eye groups at day 10. *P<0.05 vs. EDE; †P<0.05 vs. 0.05% CsA. UT, untreated control; EDE, experimental dry eye; CsA, cyclosporin A; CE, cationic emulsion; IL-17, interleukin-17.

