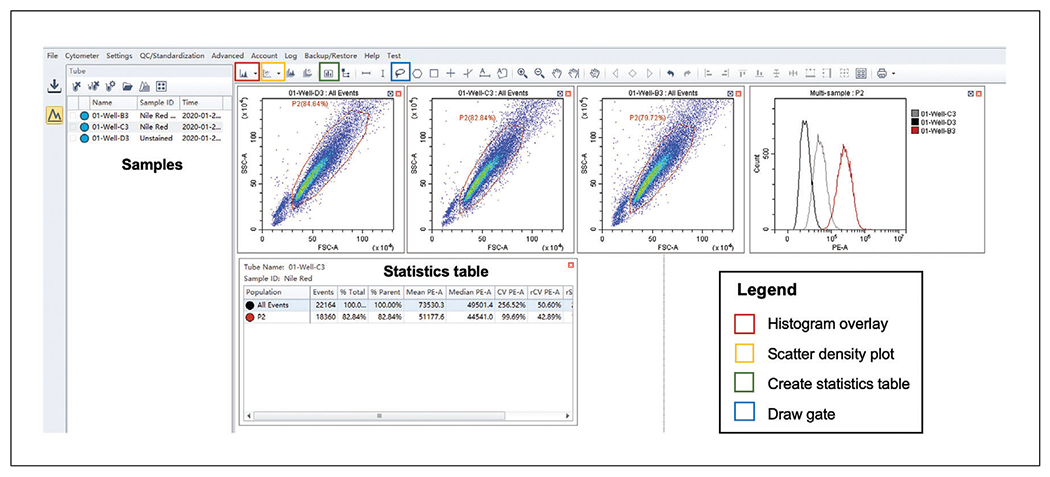
Figure 4.

CytExpert display on the Analyze tab. Recommended layout of CytExpert Analyze display allowing gating of sample populations (blue box on menu bar) on density scatter plots (yellow box on menu bar). Samples can be dragged from the panel on the left to populate these plots as well as a histogram overlay plot (red box on menu bar). Finally, a statistics table can be generated (green box on menu bar) to determine raw values such as mean and median channel fluorescence.
