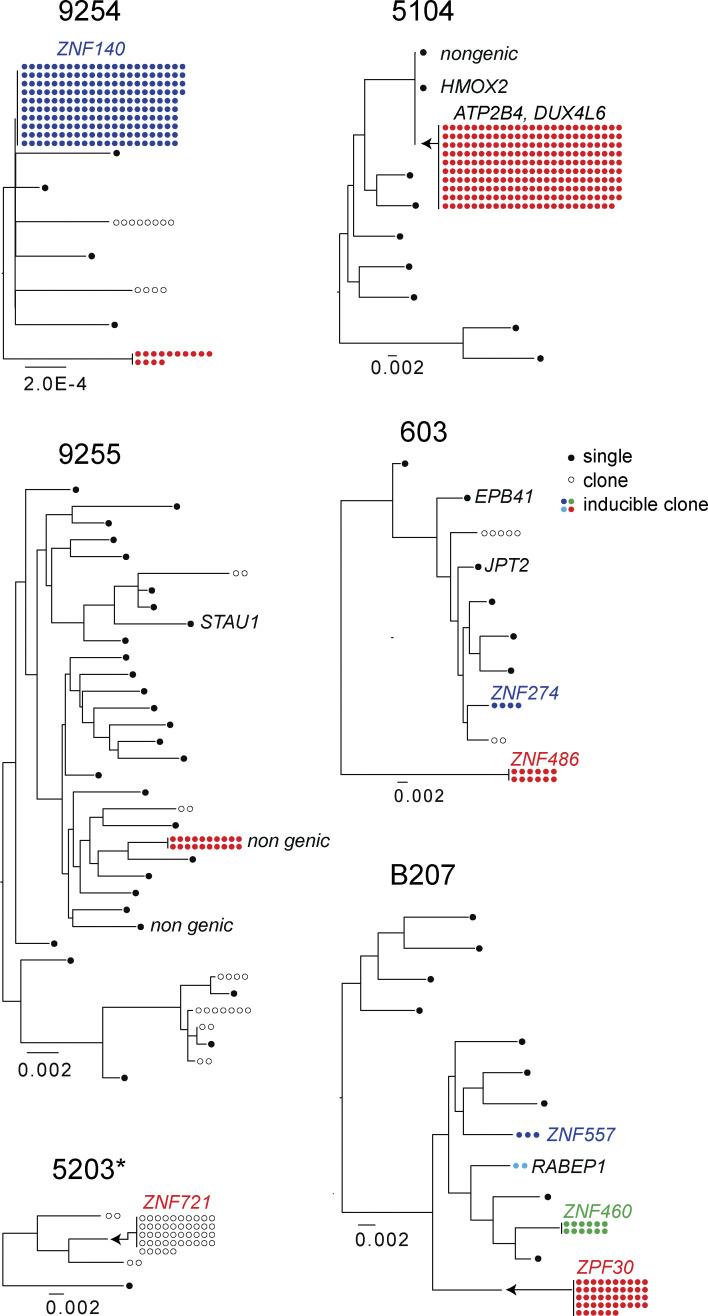
Figure 2.
Maximum likelihood phylogenetic trees of intact NFL sequences obtained by Q4PCR and MIP-seq (Einkauf et al., 2019; Lorenzi et al., 2016). Filled circles represent inducible clones, and the number of circles is proportional to the size of the clone. Outlined circles represent NFL HIV-1 clones detected by PCR, but not by outgrowth assays. Black circles represent unique proviruses detected only once. Integration sites indicated by adjacent text. *Viral outgrowth assay not performed.

