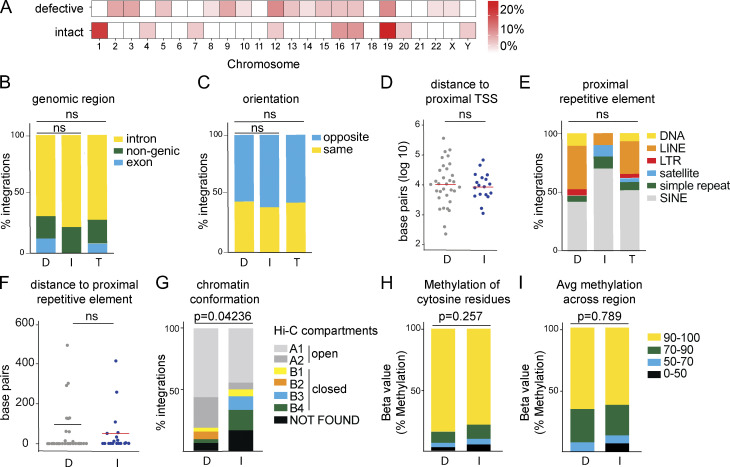
Figure 3.
Genomic features of defective (D), intact (I), and total (T) integration sites in ART-treated individuals. (A) Upper heat map depicts proportion of HIV-1 defective integration sites in each chromosome; bottom heat map depicts proportion of HIV-1 intact integration sites in each chromosome (see Table S2). (B) Proportion of integrations in introns, exons, or nongenic regions. (C) Proportion of proviruses integrated in opposite or the same direction as host gene transcription. (D) Distance, in base pairs, of integration from nearest TSS. (E) Proportion of integrations in different repetitive elements classified by University of California, Santa Cruz RepeatMasker (Jurka, 2000). (F) Distance, in base pairs, of integrations from nearest repetitive element. (G) Proportion of intact and defective proviral sequences mapped within chromatin structural compartments A and B and their respective sub-compartments as determined by Hi-C sequencing data (see Table S2; Rao et al., 2014). P value refers to proportion of integrations in compartment A as determined by two-proportion Z-test. (H) Methylation 1,000 bp upstream of HIV-1 proviral promoter integration site in CD4+ T cells (Komaki et al., 2018). Proportion of intact and defective proviral integrations with average number of cytosine residues with indicated levels of methylation. (I) Proportion of intact and defective proviral integrations with indicated methylation levels for all residues. P values determined by two-tailed Fisher’s exact test. Avg, average; LINE, long interspersed nuclear element; SINE, short interspersed nuclear element.

