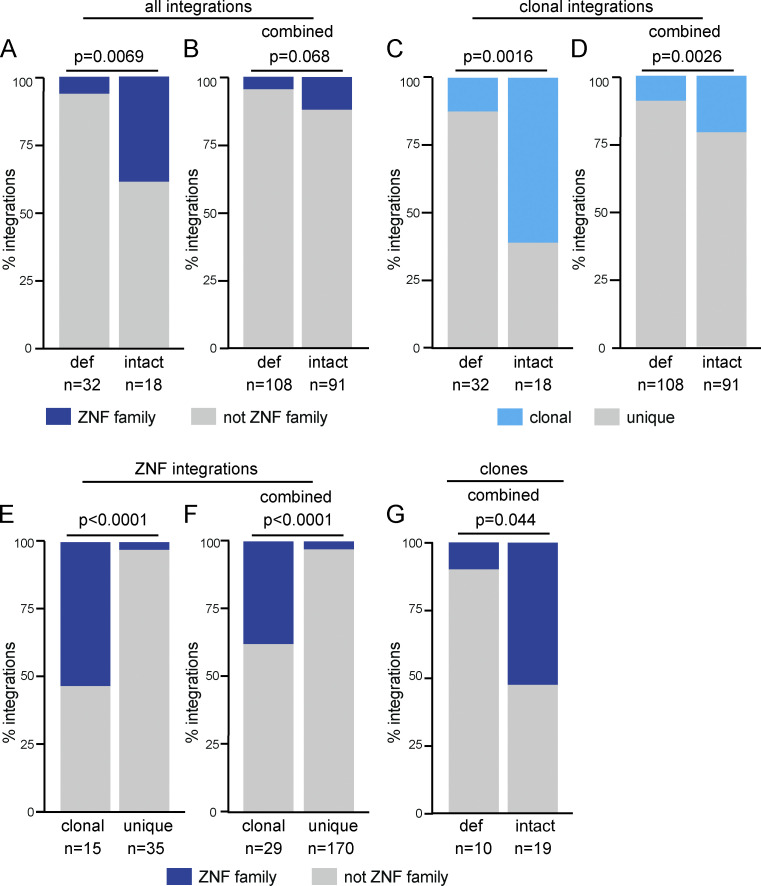
Figure 4.
Frequency of integrations into ZNF genes. (A and B) Proportion of intact and defective (def) proviral integrations mapped to ZNF genes in long-term ART-treated individuals mapped (A) in this study and (B) in combination with long-term ART-treated individuals reported by others (Einkauf et al., 2019). (C and D) Proportion of clonal versus nonclonal defective and intact integrations in long-term ART-treated individuals mapped (C) in this study and (D) in combination with long-term ART-treated individuals reported by others (Einkauf et al., 2019). (E and F) Proportion of clonal and nonclonal integrations mapped in ZNF genes found in long-term ART-treated individuals (E) in this study and (F) in combination with long-term ART-treated individuals reported by others (Einkauf et al., 2019). (G) Proportion of defective and intact clones in ZNF genes from combined analysis with long-term ART-treated individuals reported by others (Einkauf et al., 2019). All P values determined by two-tailed Fisher’s exact test.

