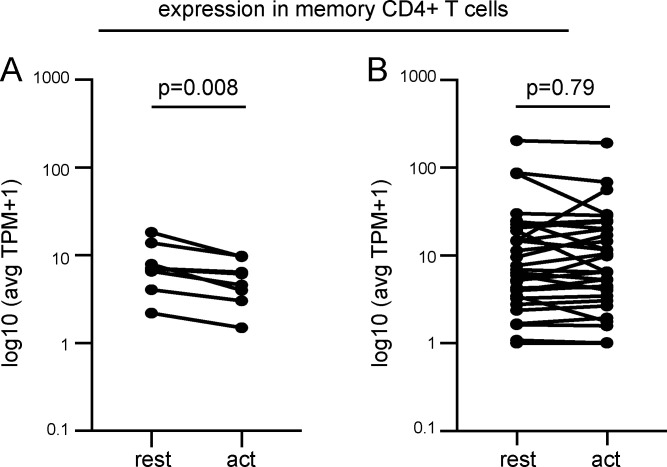
Figure S3.
Comparison of expression levels in ZNF and non-ZNF genes in memory CD4+ T cells with integrations in this study alone. (A) Expression of ZNF genes with mapped integrations, at rest and upon activation with α-CD3/α-CD28 human T-Activator Dynabeads (act). (B) Expression of non-ZNF genes with mapped integrations, at rest and upon activation (act; see Table S2). P values determined by Wilcoxon signed-rank test. avg, average; TPM, transcripts per million.

