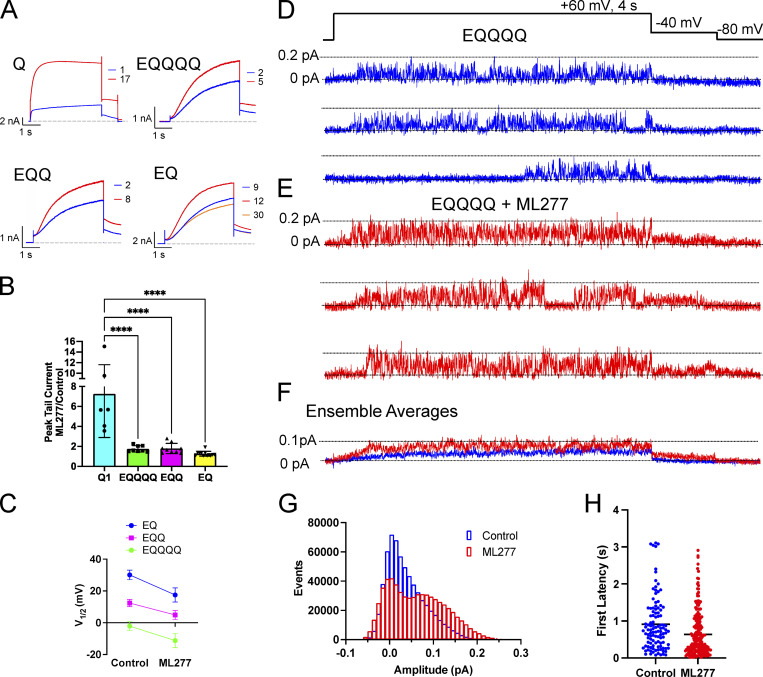
Figure 2.
ML277 increases amplitude of EQQQQ openings. (A) Representative whole-cell current traces from cells before (blue trace) and after exposure to 1 µM ML277 (red trace) for channel complexes containing increasing numbers of KCNE1. The example for EQ shows an extra sweep in orange to highlight the current rundown that took place after 8 min recording. (B) Bar chart showing the tail current amplitude in ML277 divided by control amplitude for Q1 and WT IKs of different stoichiometries. ****, P < 0.0001. (C) V1/2 of activation before and after 1 µM ML277 treatment for EQ, EQQ, and EQQQQ (n = 6–12). See Table 1 for slope factors. All error bars denote mean ± SEM. (D and E) Representative single-channel recordings of EQQQQ in control (D) and in 1 µM ML277 (E) from the same patch. The voltage protocol is shown above the control sweeps, and the interpulse interval was 10 s. (F) Ensemble average currents of 16 active sweeps in control EQQQQ (blue trace) and after 1 µM ML277 treatment (red trace) from the same patch. (G) All-points histograms of the same data used in F. (H) First latencies for EQQQQ in control and ML277 conditions. Mean first latencies were 0.91 ± 0.07 s for control (108/287 active, 38%) and 0.64 ± 0.04 s in the presence of ML277 (223/703 active, 32%), n = 3.

