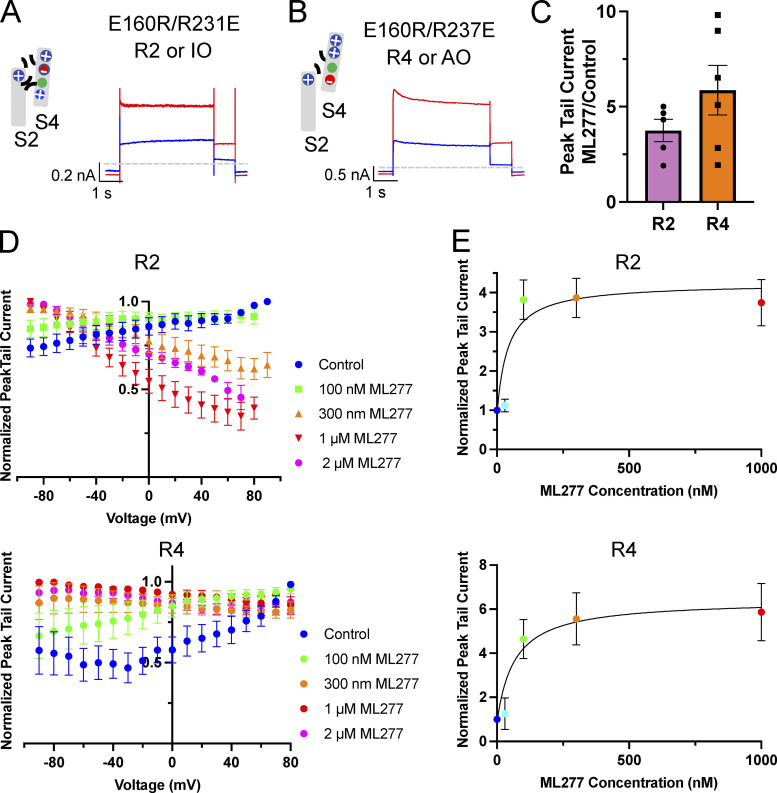
Figure 4.
R2 and R4 mutants also respond to ML277 with an increase in current amplitude. (A and B) Cartoons representing the putative interactions between the charges in the S2 and S4 TMDs of the VSDs that hold them in the IO state (R2; A) and the AO state (R4; B). Next to the cartoons are representative whole-cell current traces from cells before (blue trace) and after exposure to 1 µM ML277 (red trace). Cells were held at −90 mV and pulsed for 4 s to +60 mV and then −40 mV for 0.8 s. Interpulse interval was 15 s. (C) Bar chart of peak tail currents measured in ML277 divided by control peak current measurement for R2 (n = 4) and R4 (n = 5). The mean ratio ± SEM for R2 is 3.75 ± 0.59, and for R4 it is 5.86 ± 1.30. (D) Normalized G-V plots for R2 (top) and R4 (bottom) obtained from peak tail currents at different concentrations of ML277 as indicated (n = 3–11). Voltage protocol was the same as for A and B. (E) ML277 concentration-response curves at +60 mV for R2 (n = 3–8) and R4 (n = 2–6), using tail current data normalized to same cell control values and fit with drug versus response. Three parameter curves were used to obtain EC50s using GraphPad software.

