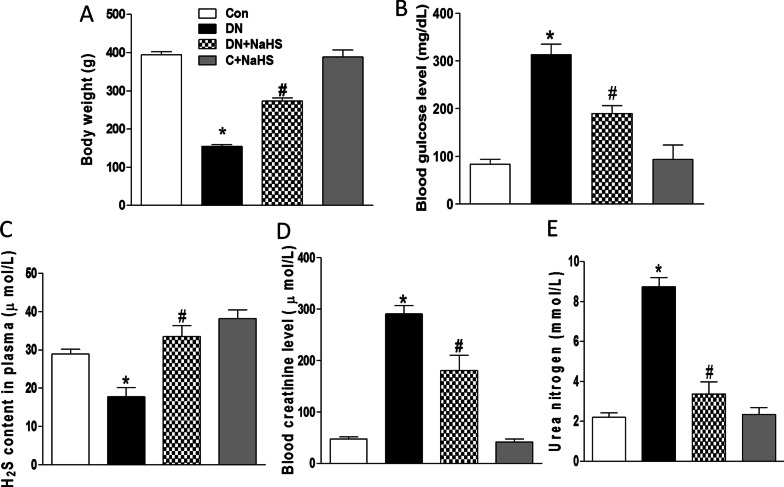
Fig. 1.
Generation of rats with diabetic nephropathy (DN).The rats were fed a high fat diet containing 0.75% adenine for 8 weeks and performed a single STZ (35 mg/kg) injection intraperitoneally. Rats were divided into four groups: control rats fed with normal diet and saline injection (C), high fat and adenine-fed and STZ-injected rats (DN), DN rats with sodium hydrosulfide (NaHS) treatment (DN + NaHS), and control rats with NaHS treatment (C + NaHS), A–E, Body weight (A), the concentration of glucose (B), H2S (C), creatinine (D), and urea nitrogen (E) in plasma were determined. n = 6 ~ 7 rats. Values represent the means ± SEM.*p < 0.05 compared to control rats. #p < 0.05 compared to DN rats

