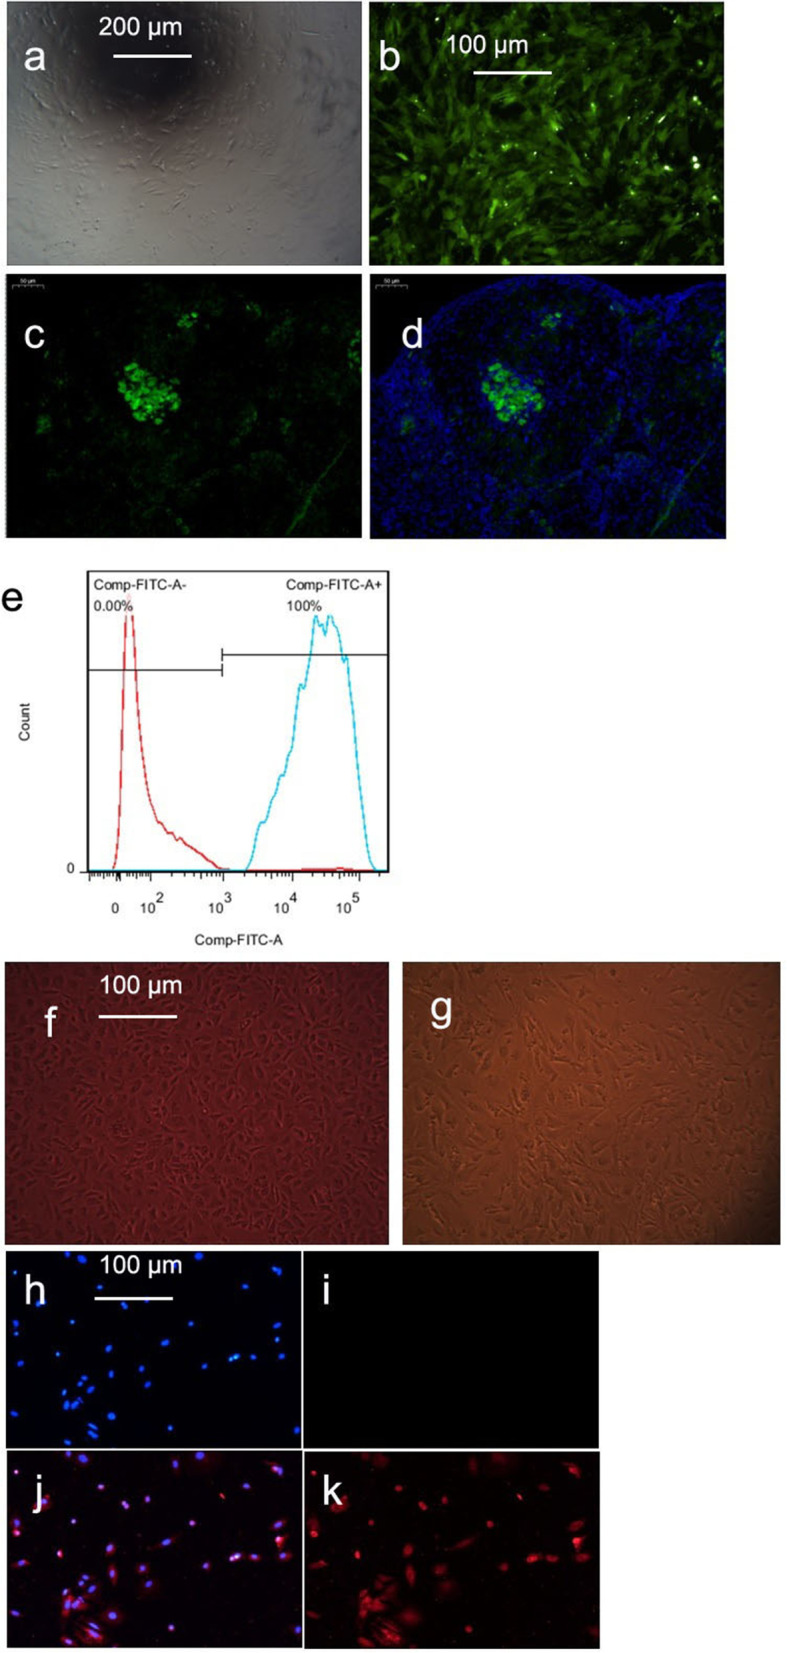
Fig. 2.

a-d GFP-labelled mUCMSCs (a: 100 × ; b, c, and d: 200 ×). a Morphology of GFP-labelled cells under an optical microscope; b morphology of GFP-labelled cells under a fluorescence microscope; c GFP-labelled cells in ovarian tissue under a fluorescence microscope; d GFP-labelled cells in ovarian tissue under a fluorescence microscope after DAPI staining; and e percentage of mUCMSCs labelled with GFP. f and g Growth and morphology of mGCs (200 ×). f Primary mGCs; g P1-generation mGCs. h–k Immunofluorescence staining of mGCs (100 ×). h Negative DAPI staining; i negative Fluoromount staining; j DAPI and FSHR staining; k Fluoromount and FSHR staining
