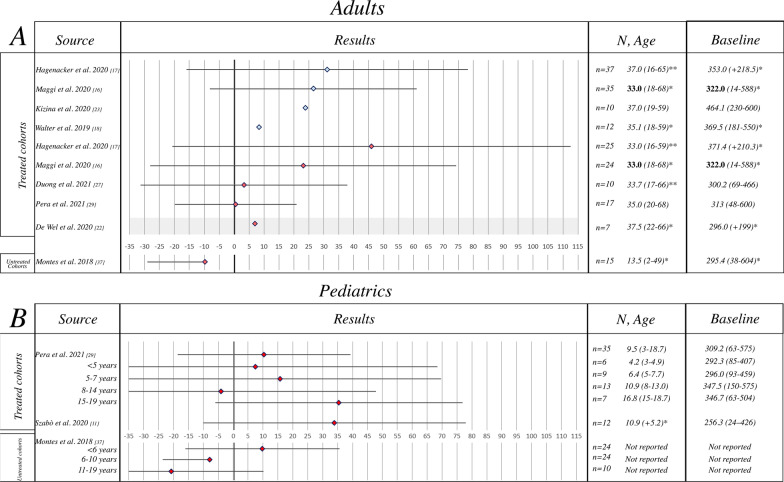
Fig. 4.
6 min-Walk Test results reporting author, results (mean ± SD), sample size, mean age (years, range/SD), mean baseline 6MWT (range/SD). a Adult population, b pediatric population. Key to figure: dashed line = 95% Confidence interval, plain line = Standard Deviation. Bold font = Median value, Italic = Mean value. Color coding: light blue = ~10 months from infusion, Red = ~12 months from infusion. *Mean/median values of the baseline population non excluding drop-outs at T10, 14 or 24 months of follow-up, **mean/median values of the baseline population of both SMA II and III combined

