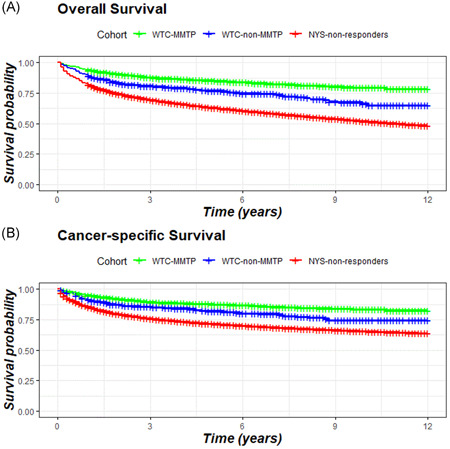
Figure 2.

Kaplan–Meier plots: (A) All‐cause and (B) cancer‐specific survival. Follow‐up starts at the time of diagnosis log‐rank p < .001. NYS‐non‐responders, all other cancer patients who were residents of the 11‐southernmost counties of New York State and were not included in one of the WTC‐responder cohorts; WTC‐MMTP, cancer patients enrolled in the World Trade Center Medical Monitoring and Treatment Program; WTC‐non‐MMTP, WTC‐exposed cancer patients who were NOT enrolled in the WTC‐MMTP. [Color figure can be viewed at wileyonlinelibrary.com]
