
Figure 3.
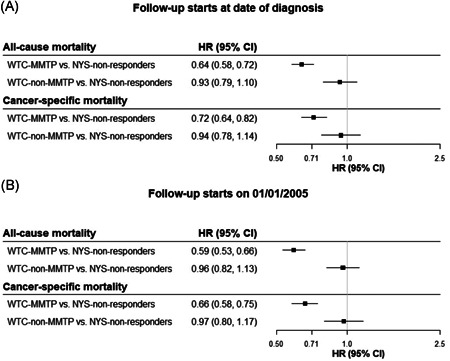
All‐cause and cancer‐specific mortality risk. Models controlled for calendar year, age, race/ethnicity, sex, cancer stage and site. 95% CI, 95% confidence interval; HR, hazard ratio; NYS‐non‐responders, all other cancer patients who were residents of the 11‐southernmost counties of New York State and were not included in one of the WTC‐responder cohorts. WTC‐MMTP, cancer patients enrolled in the World Trade Center Medical Monitoring and Treatment Program; WTC‐non‐MMTP, WTC‐exposed cancer patients who were NOT enrolled in the WTC‐MMTP